
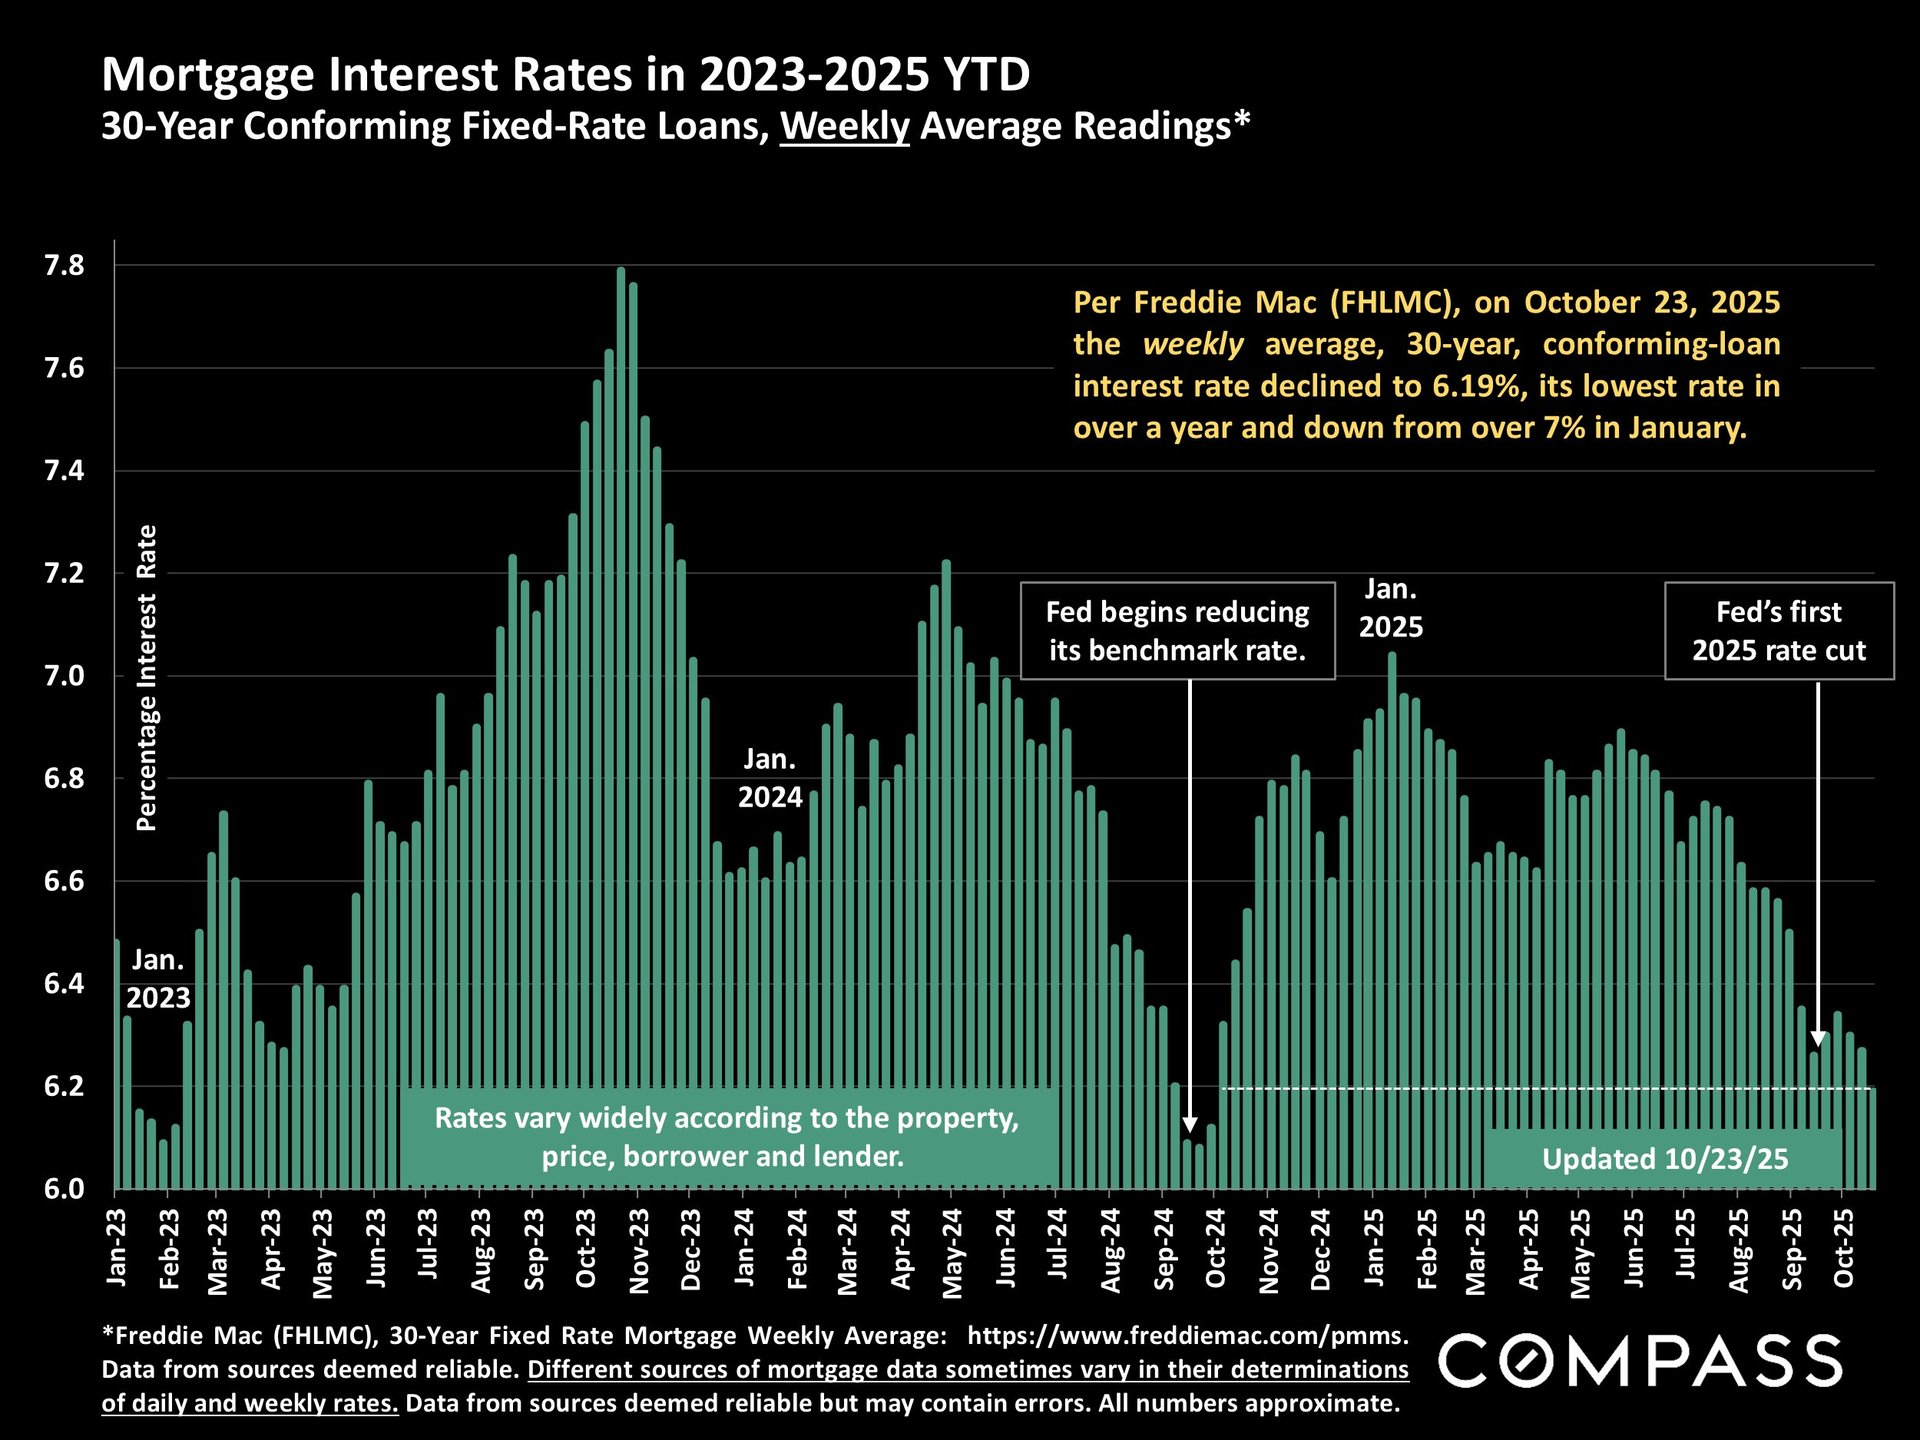
As of the third week of October, interest rates were at their lowest reading in over a year. If rates continue to drop, that would almost certainly be a major factor in Q4 buyer demand.
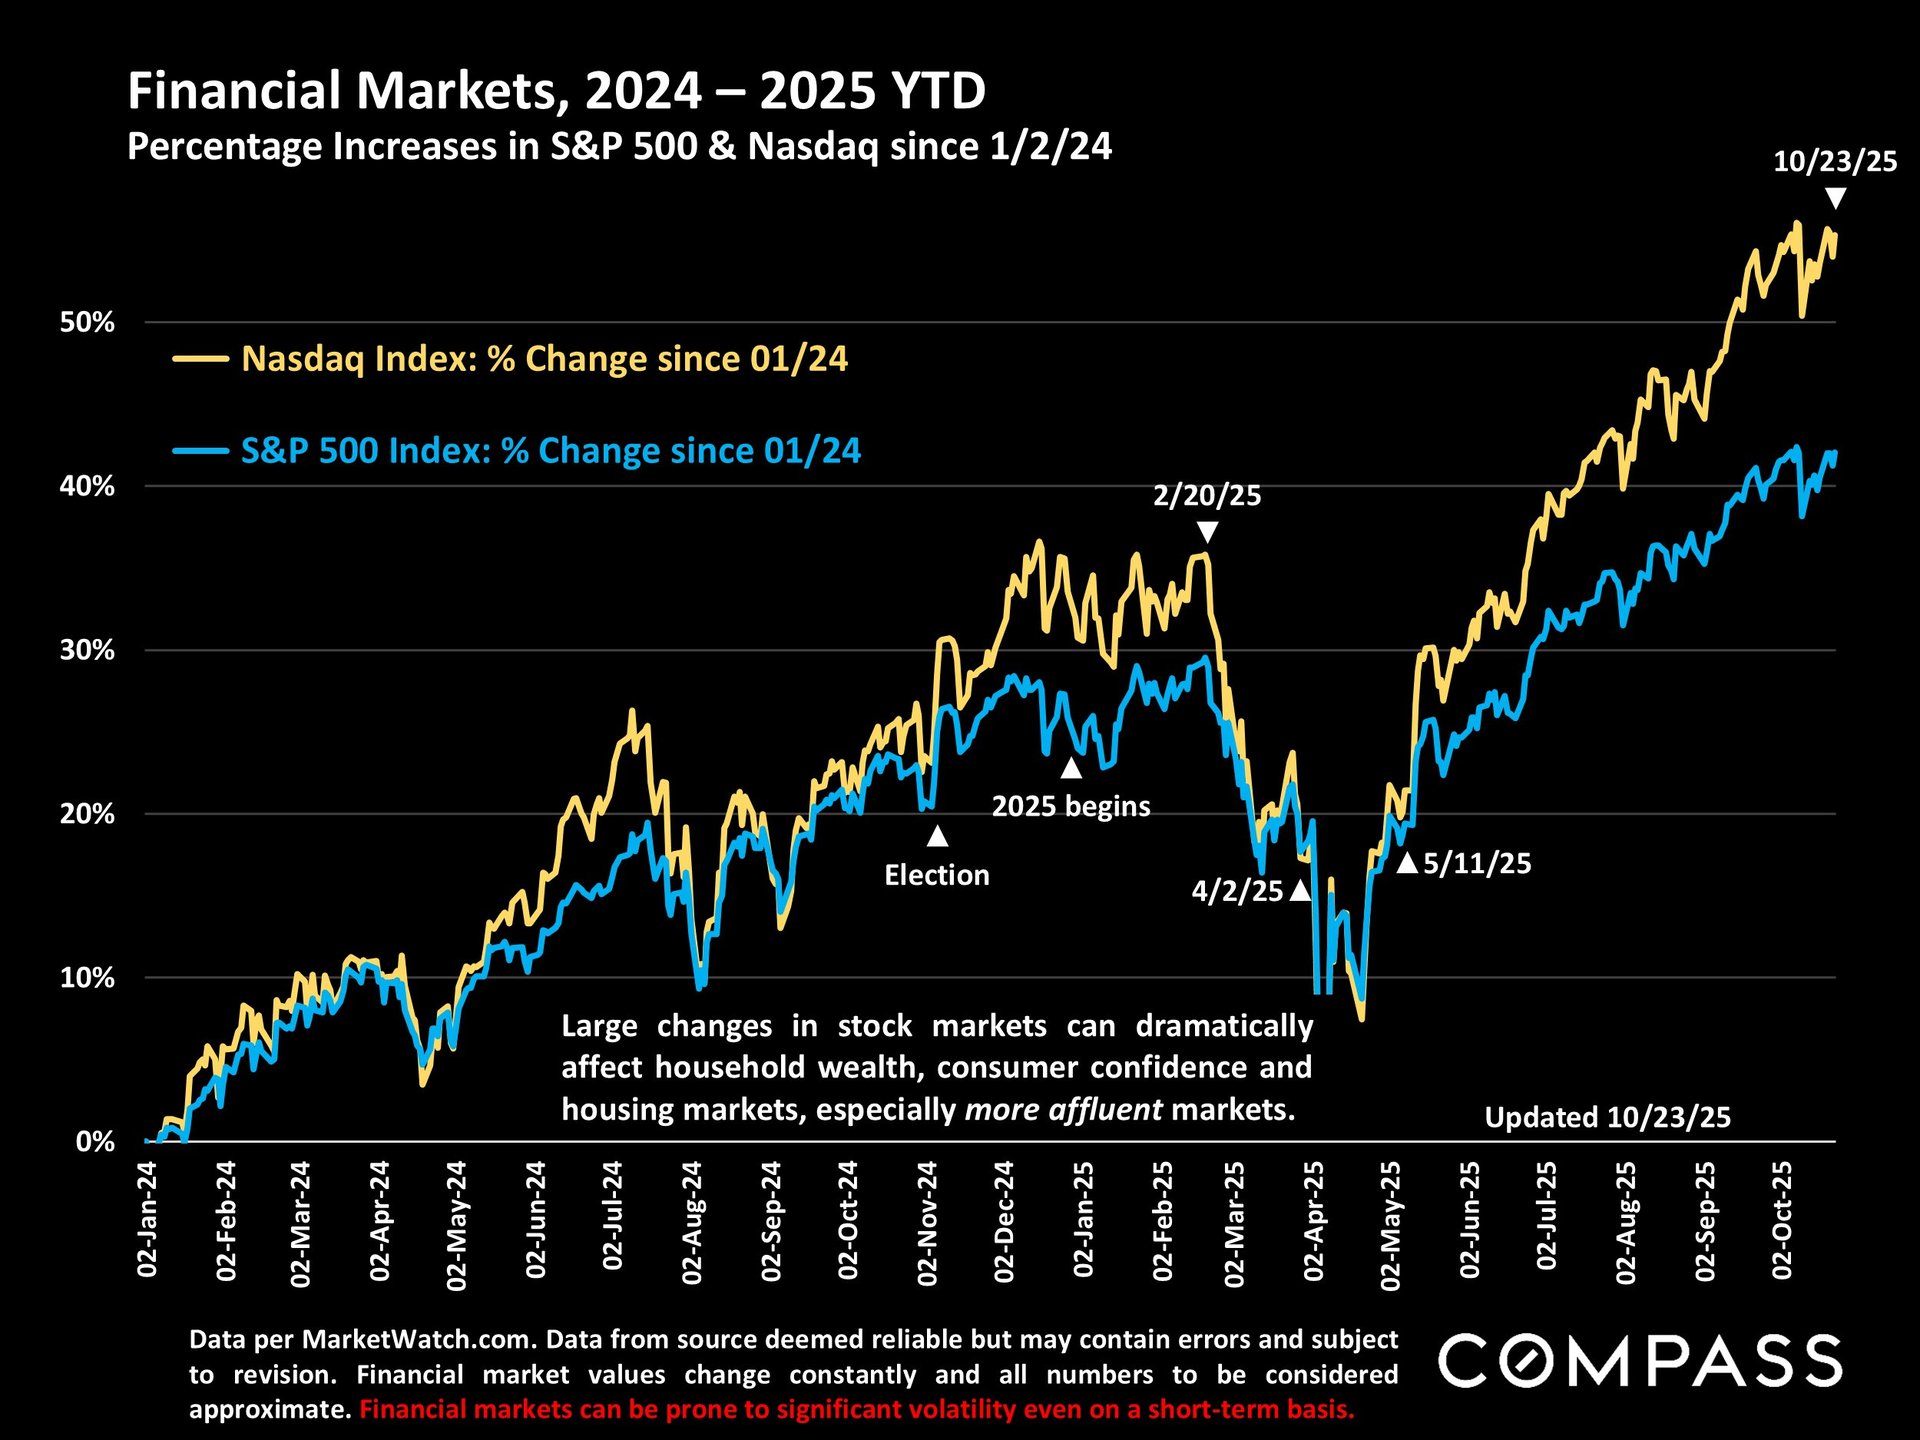
Stock markets remain very close to their peaks in September, with often enormous effects on the household wealth of those invested.
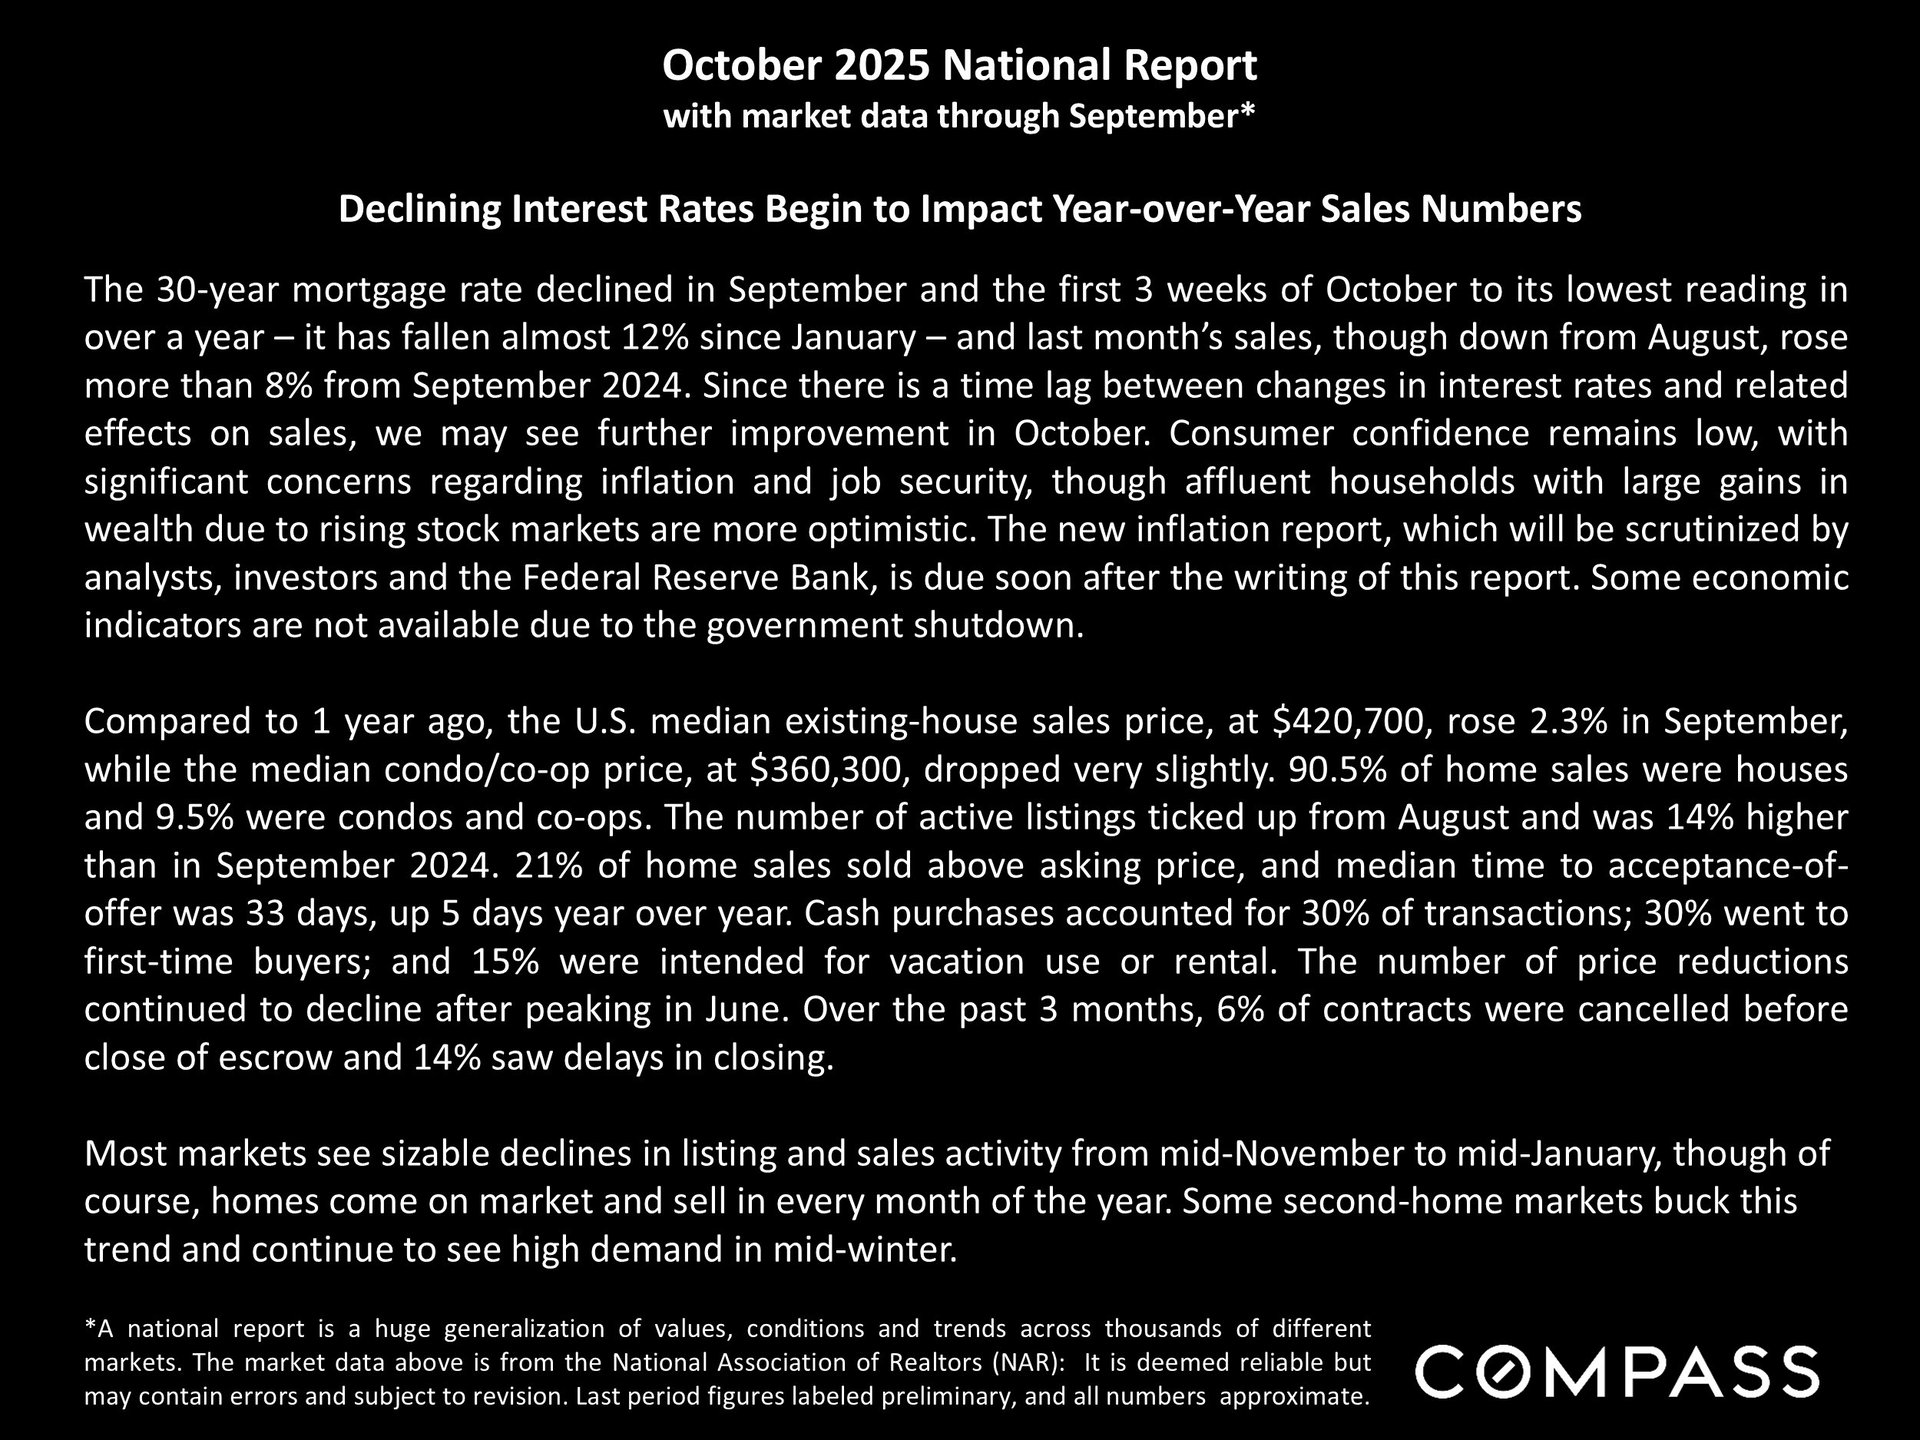
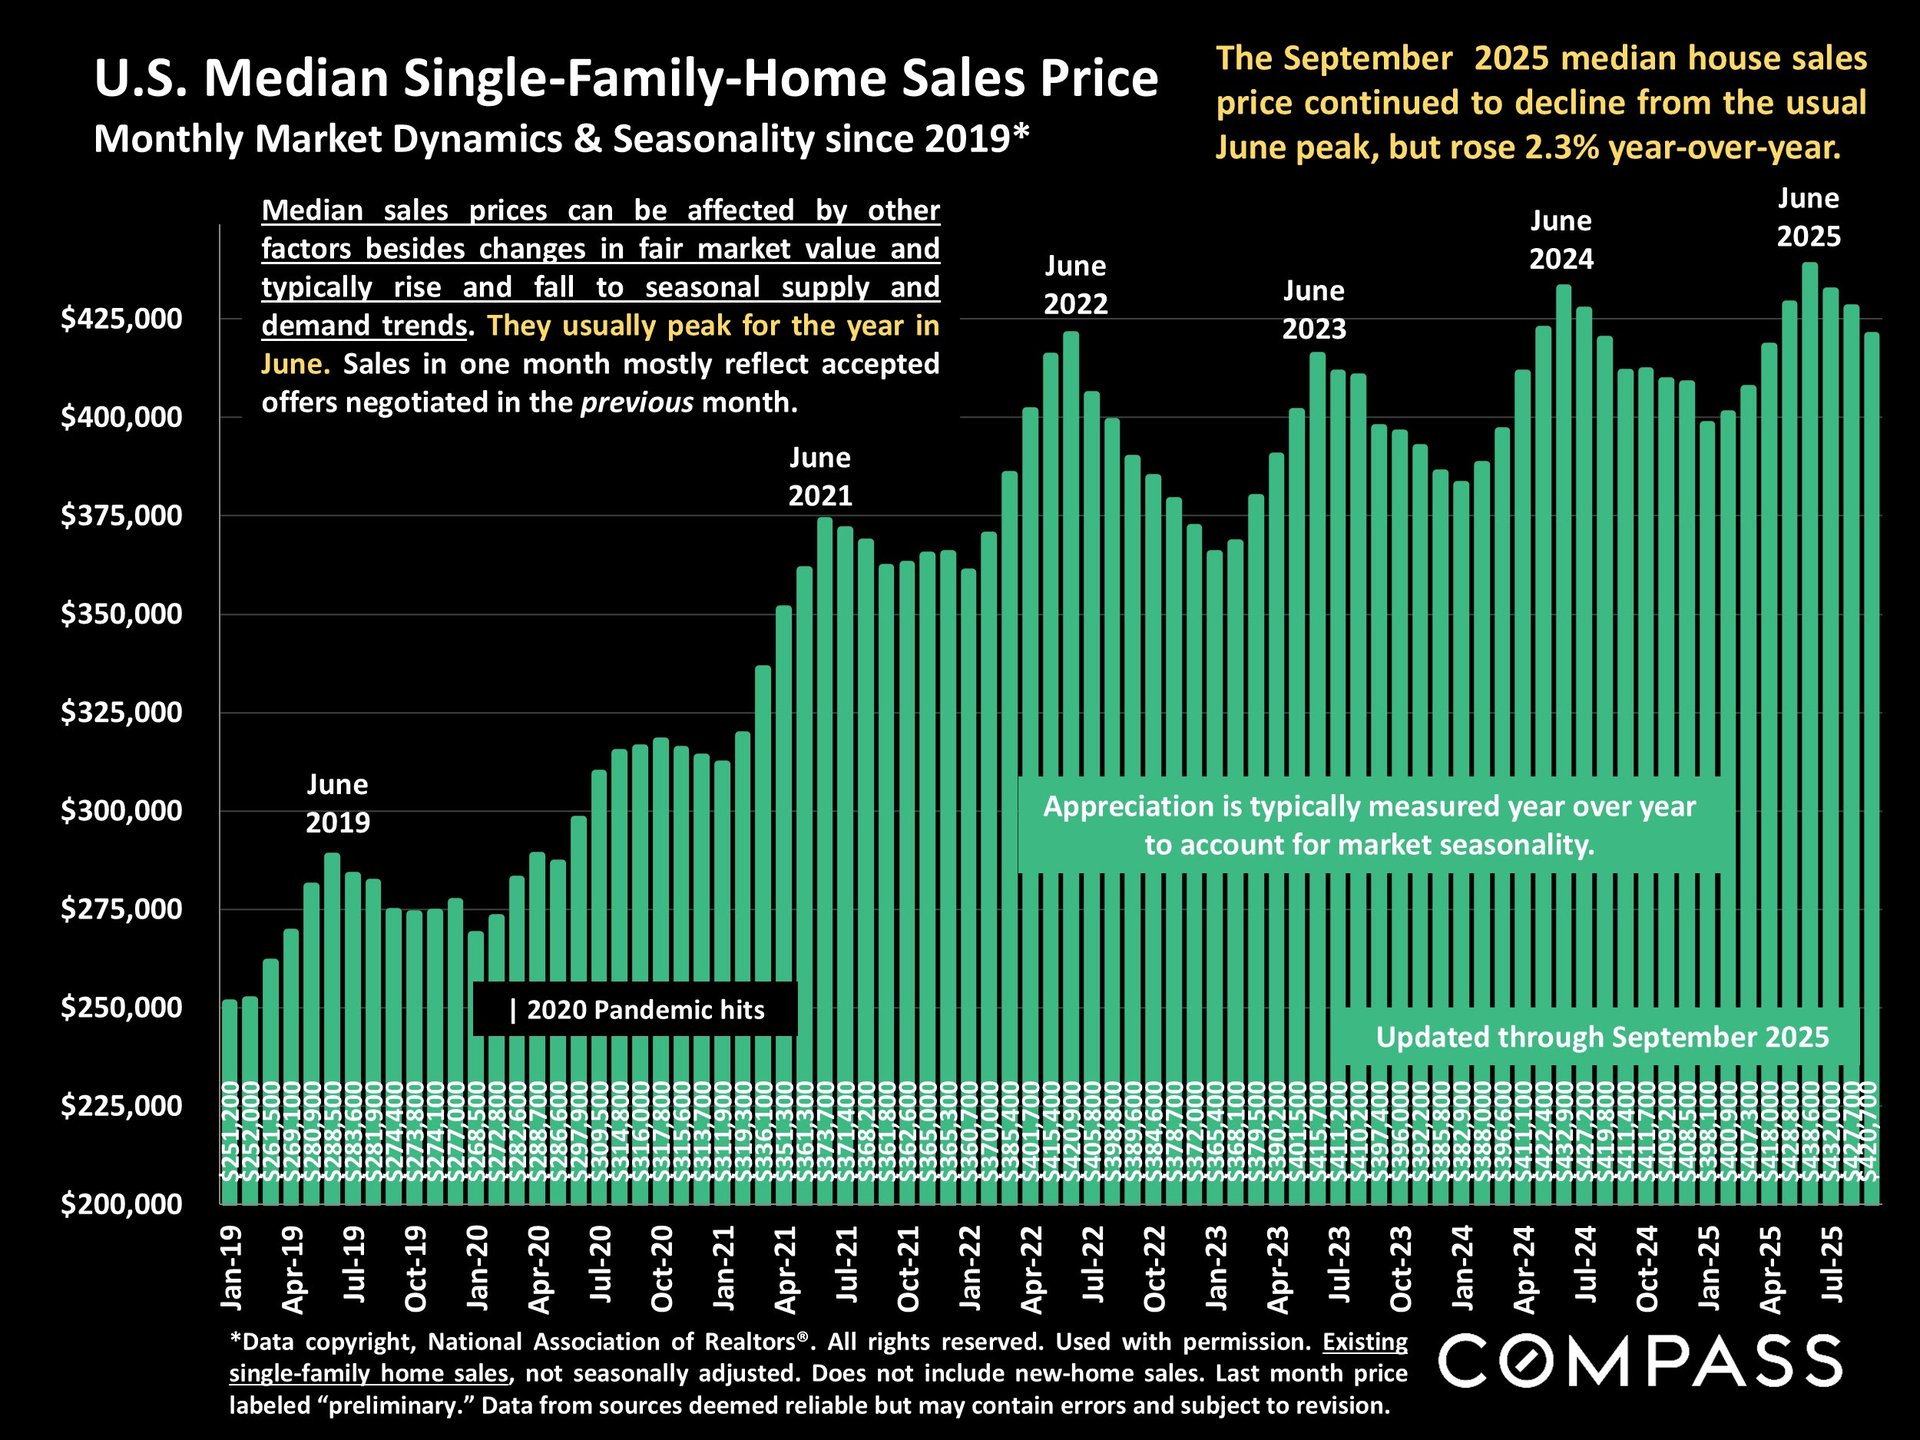
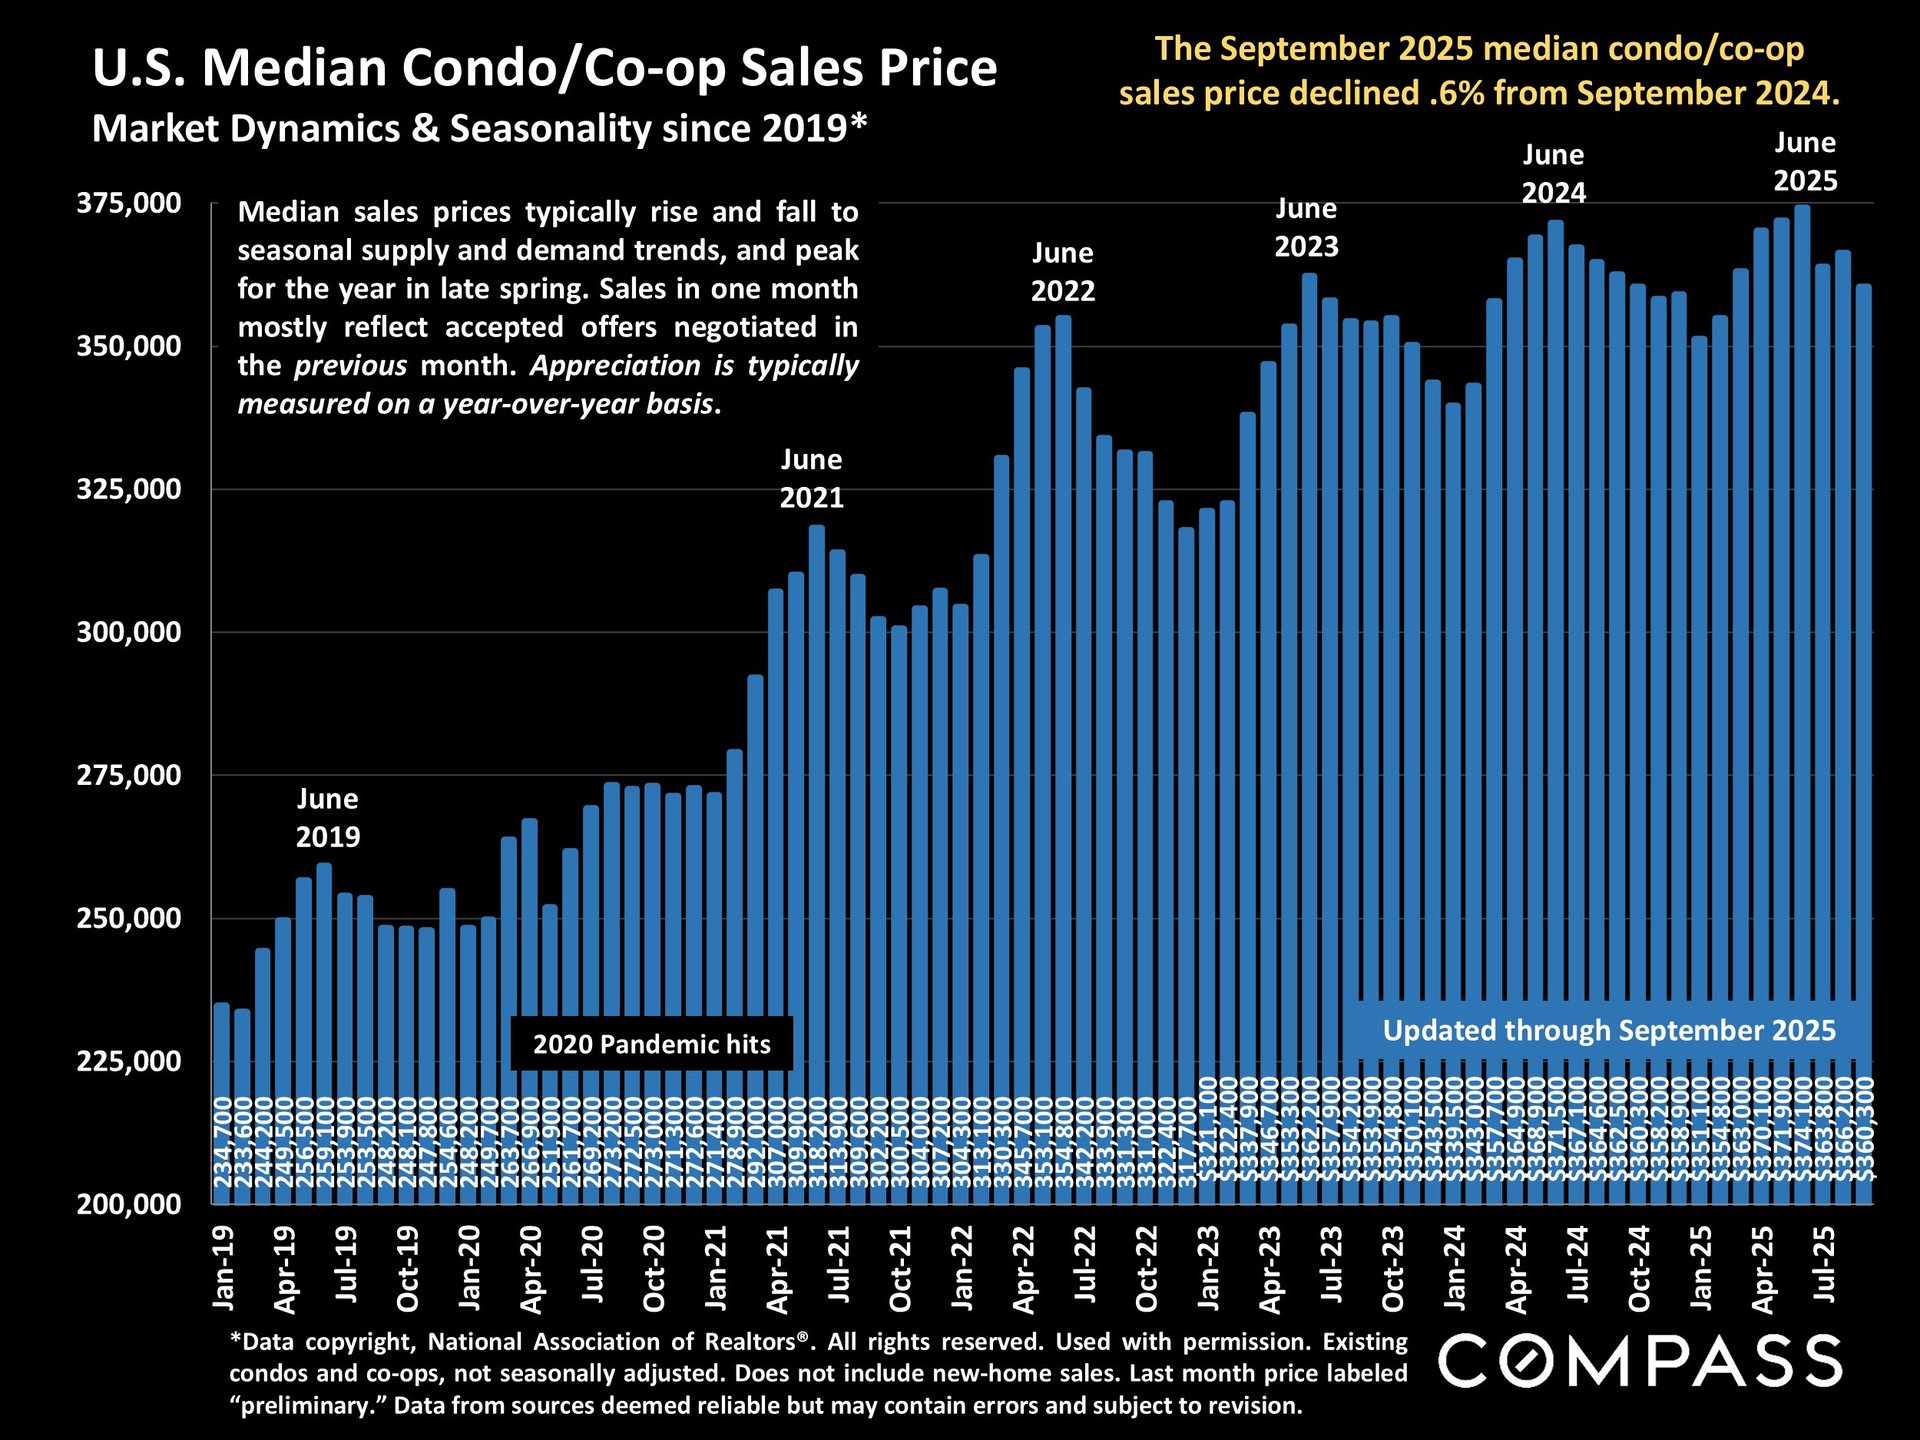
Median sales prices for both houses and condos & co-ops have declined from their annual peaks in June, but on a year-over-year basis, the median house price is up 2.3% and the median condo/co-op price is slightly down (.6%).
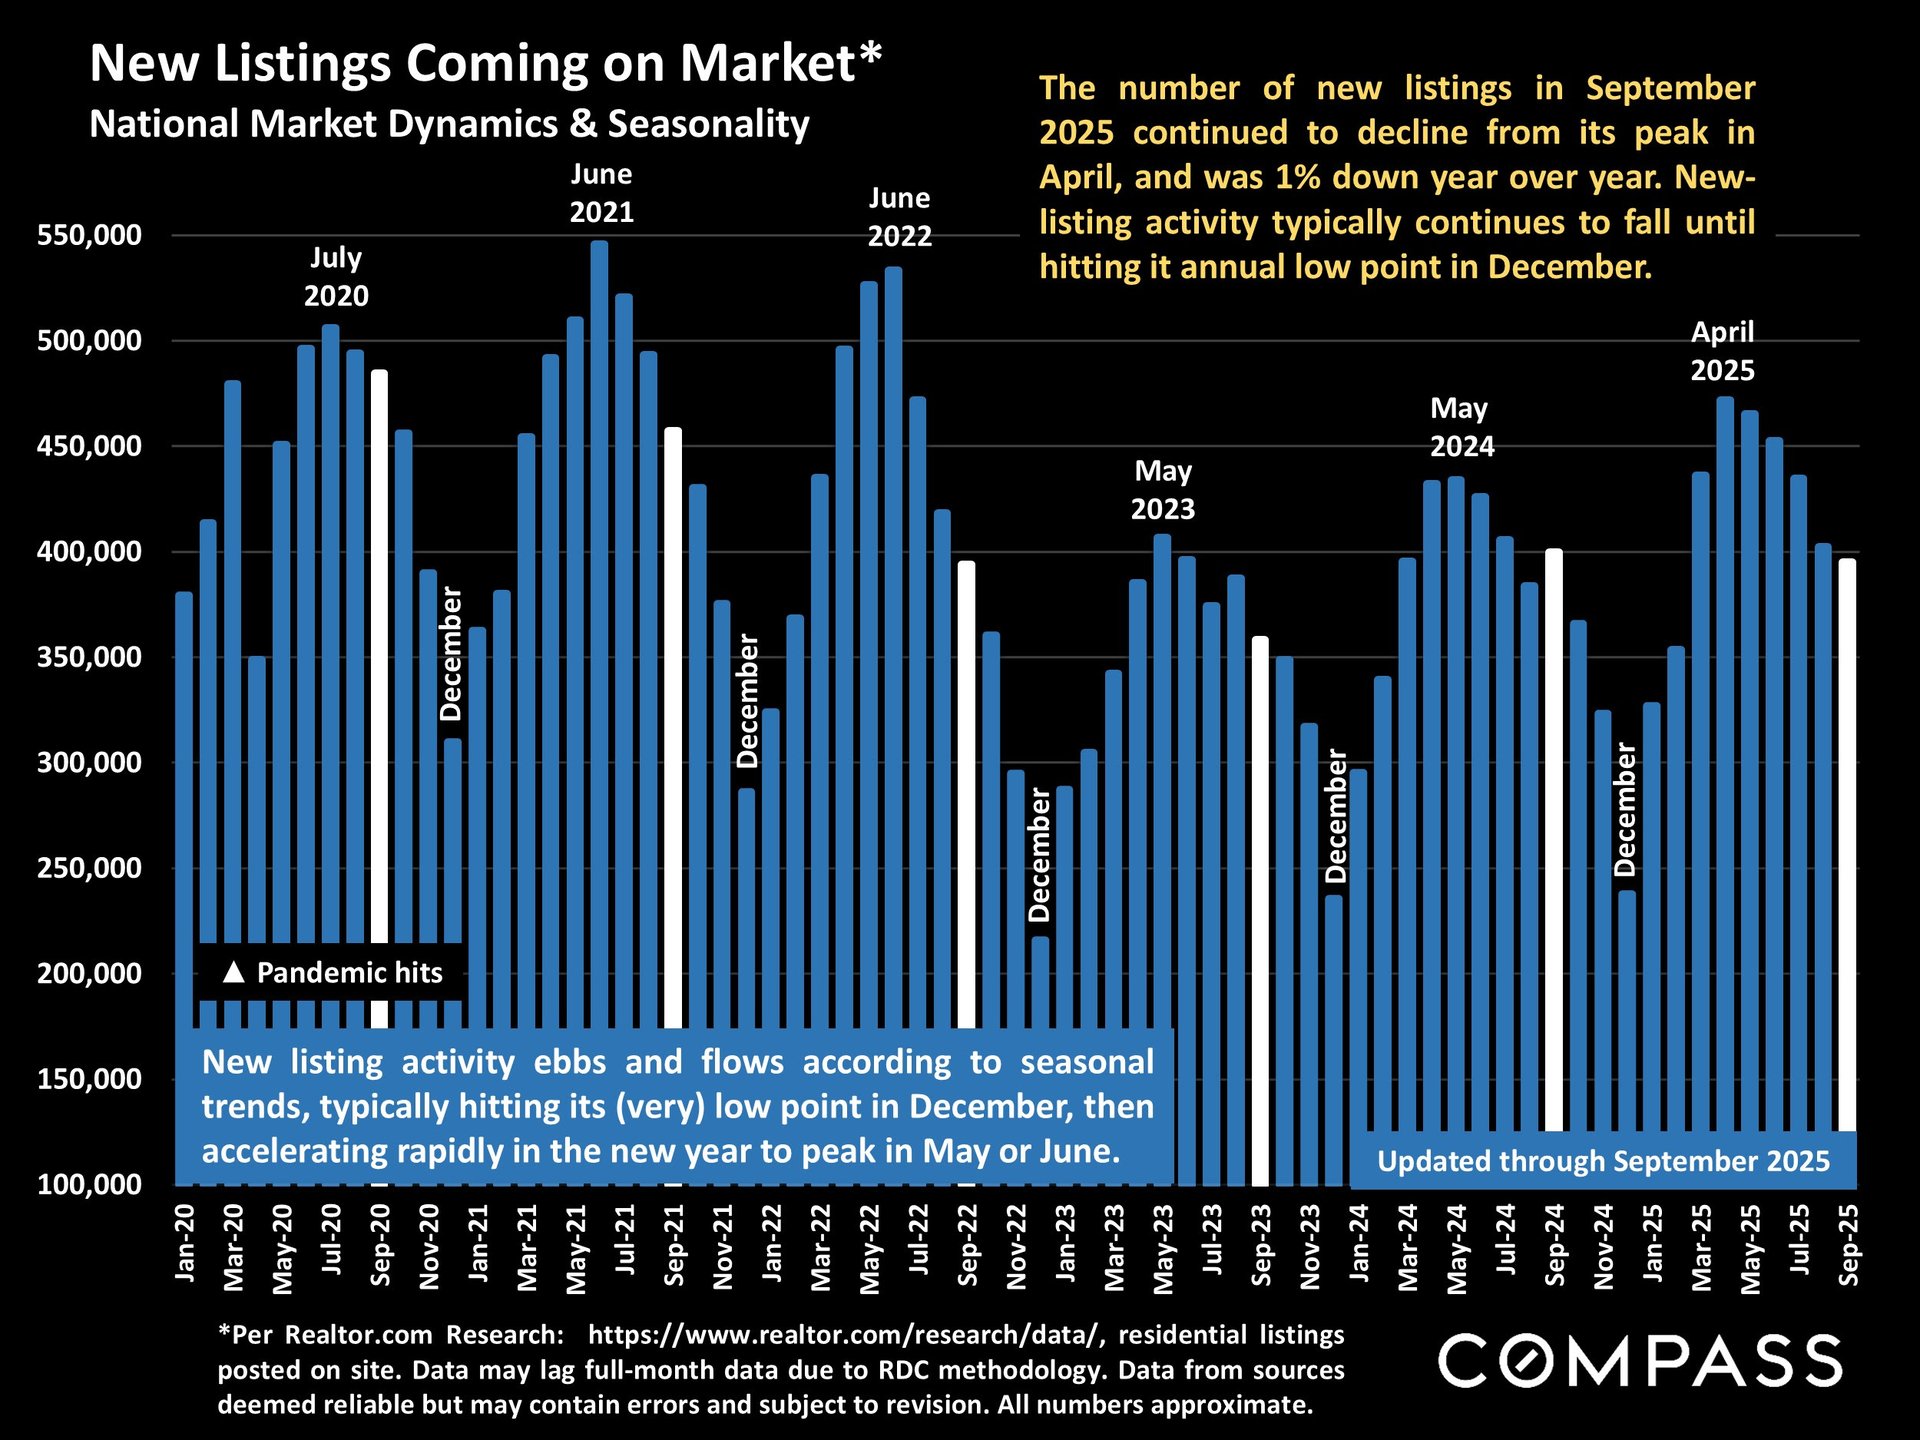
Reversing the trend seen in most of 2025, the number of new listings coming on market in September declined year over year.
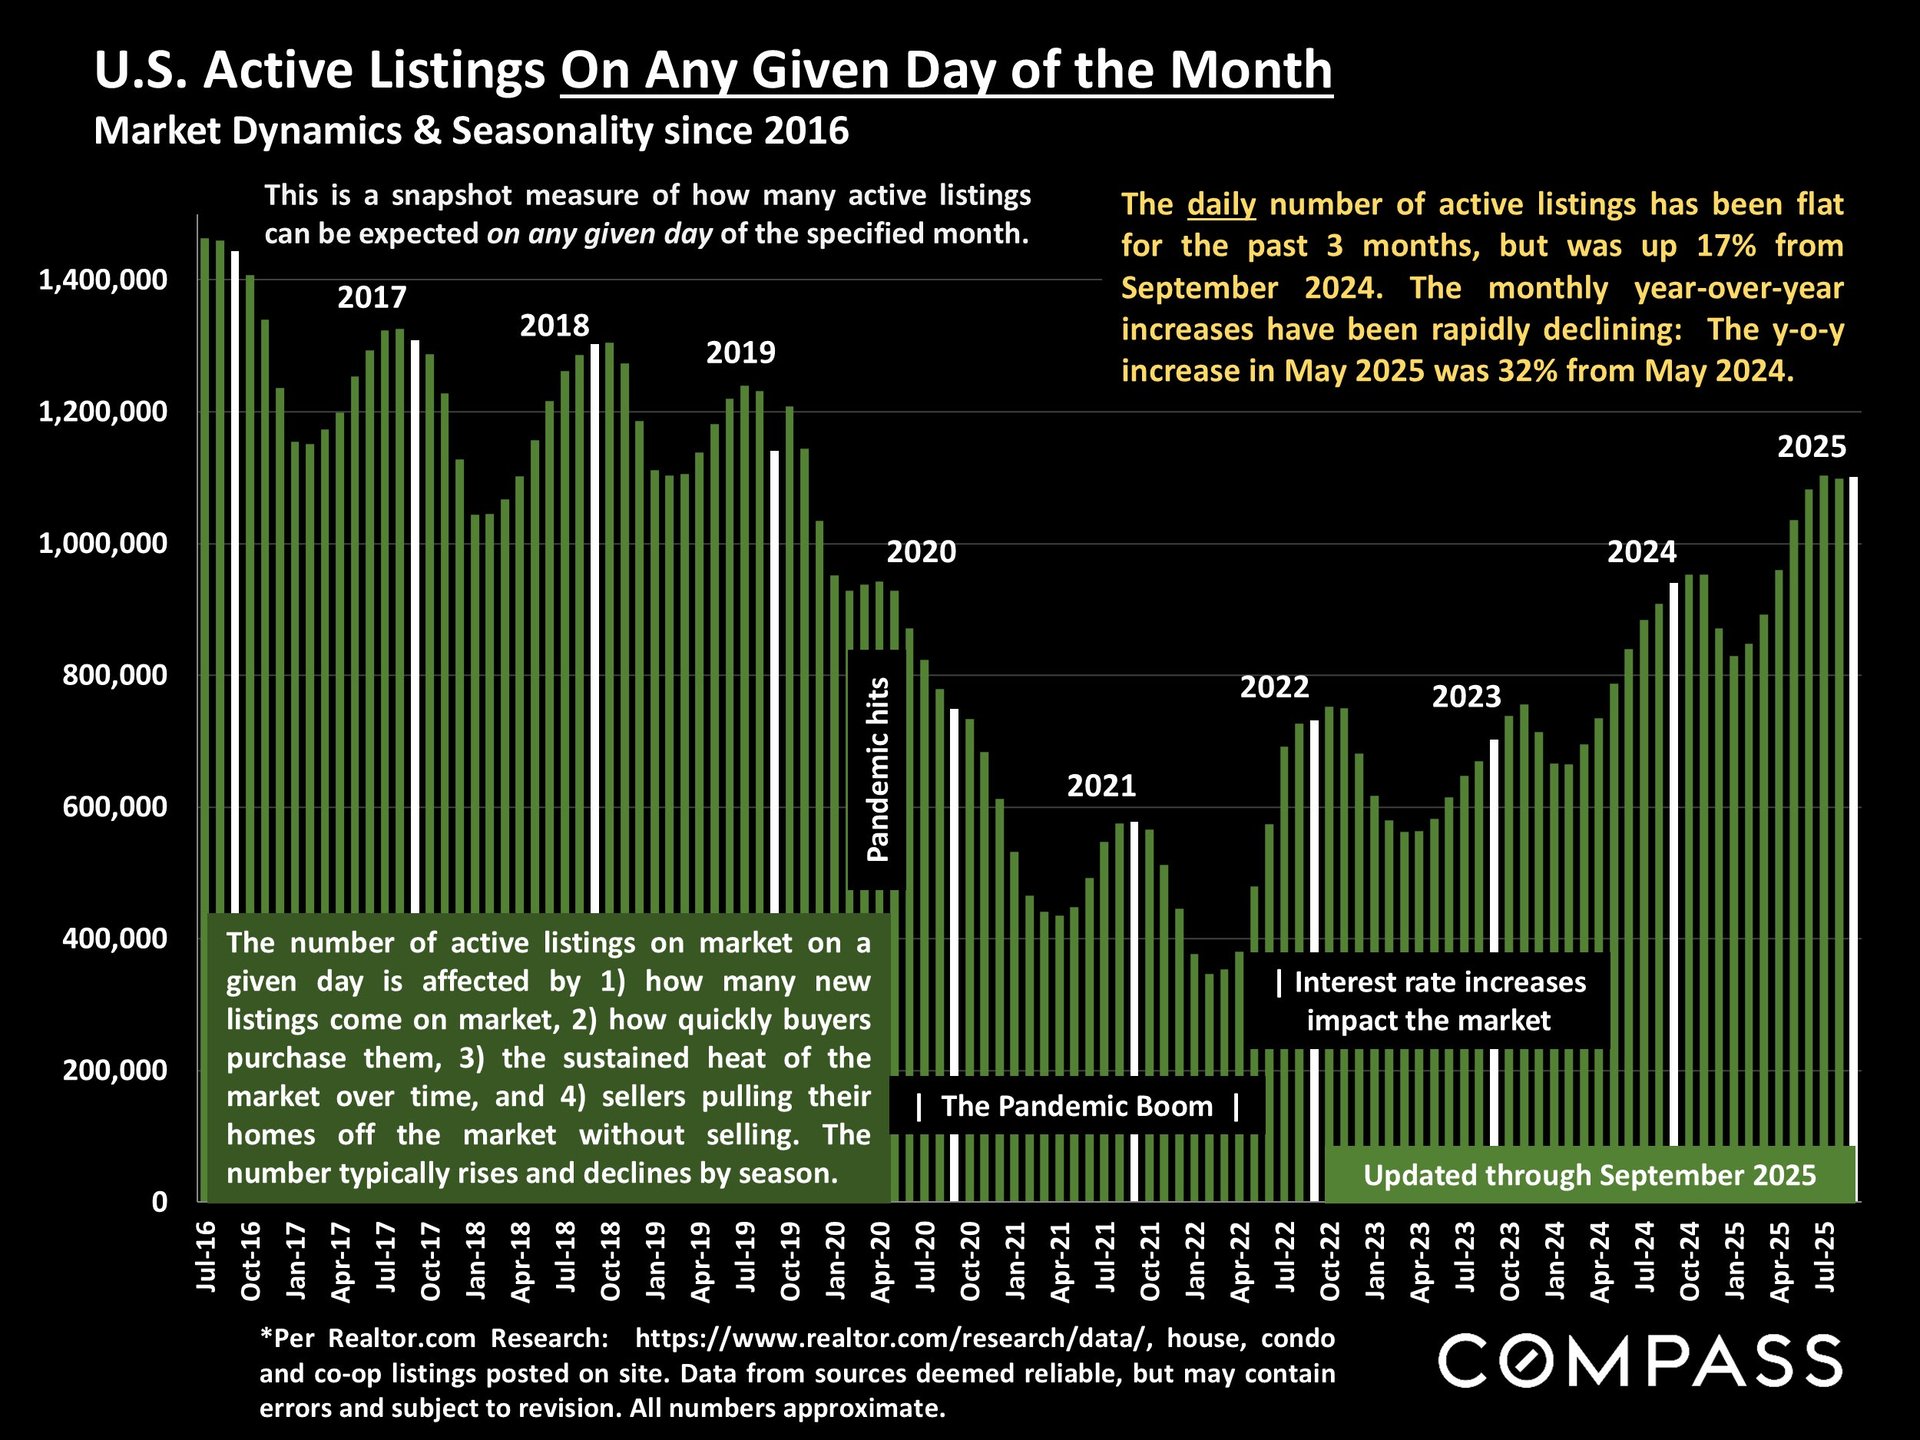
The number of active listings on the market on any given day of September was essentially unchanged from July and August, but rose 17% from September 2024. The inventory of homes for sale has been running at its highest count since 2019, but the pace of the monthly year-over-year increases is slowing.
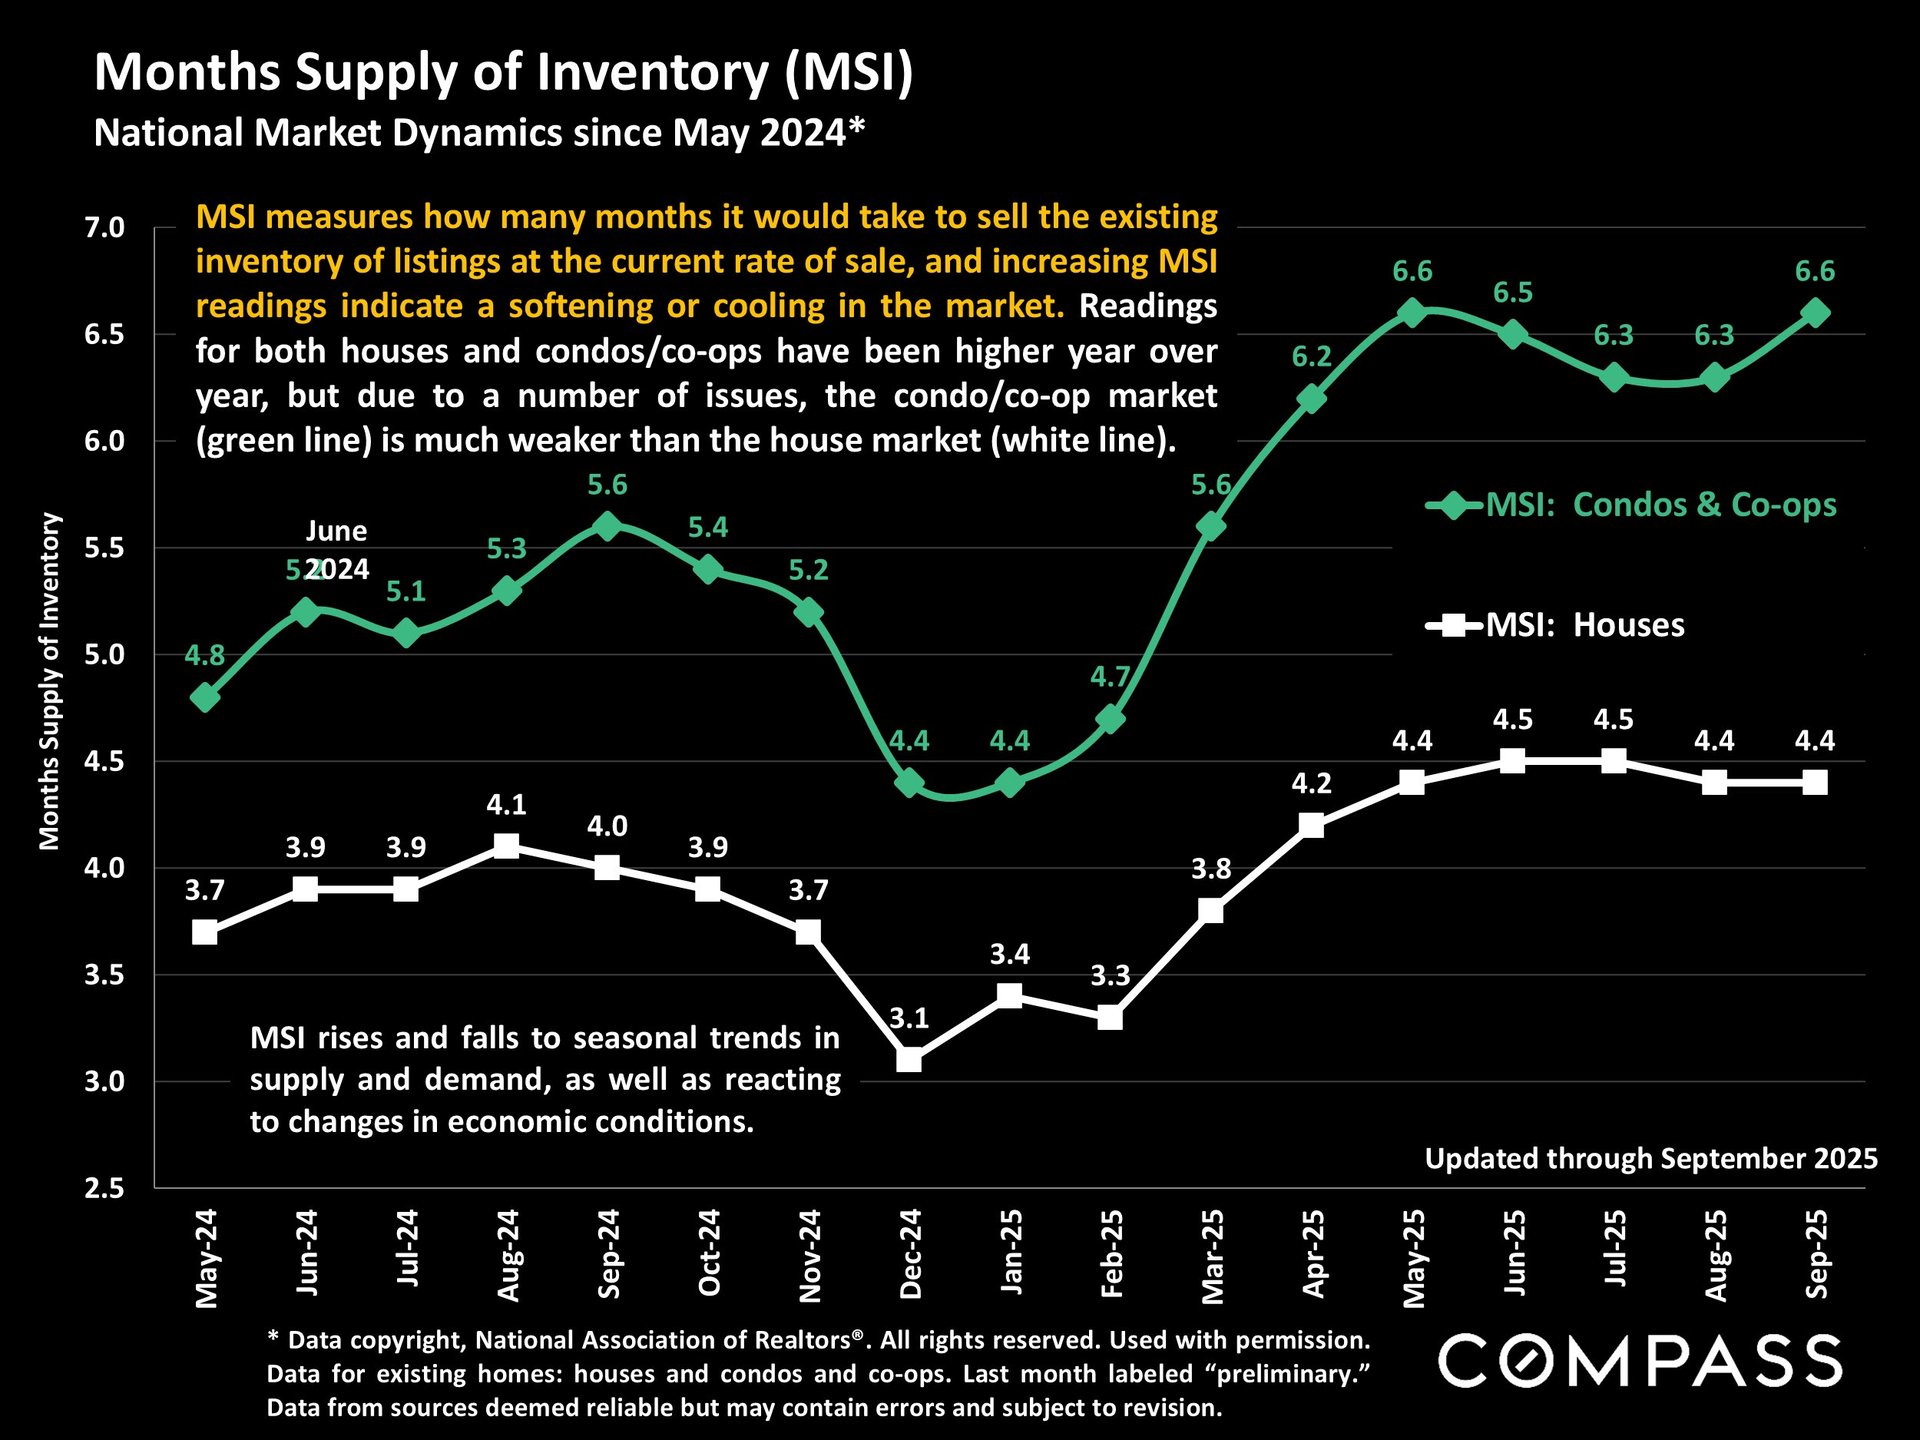
Months-supply-of-inventory (MSI) is a comparison of demand to the supply of listings for sale: The higher the reading, the larger the supply, and the softer and less competitive the market. While MSI has been running higher on a year-over-year basis for both houses and condos & co-ops, the house market has been substantially stronger, while the weakening of the condo/co-op market has been more accelerated.
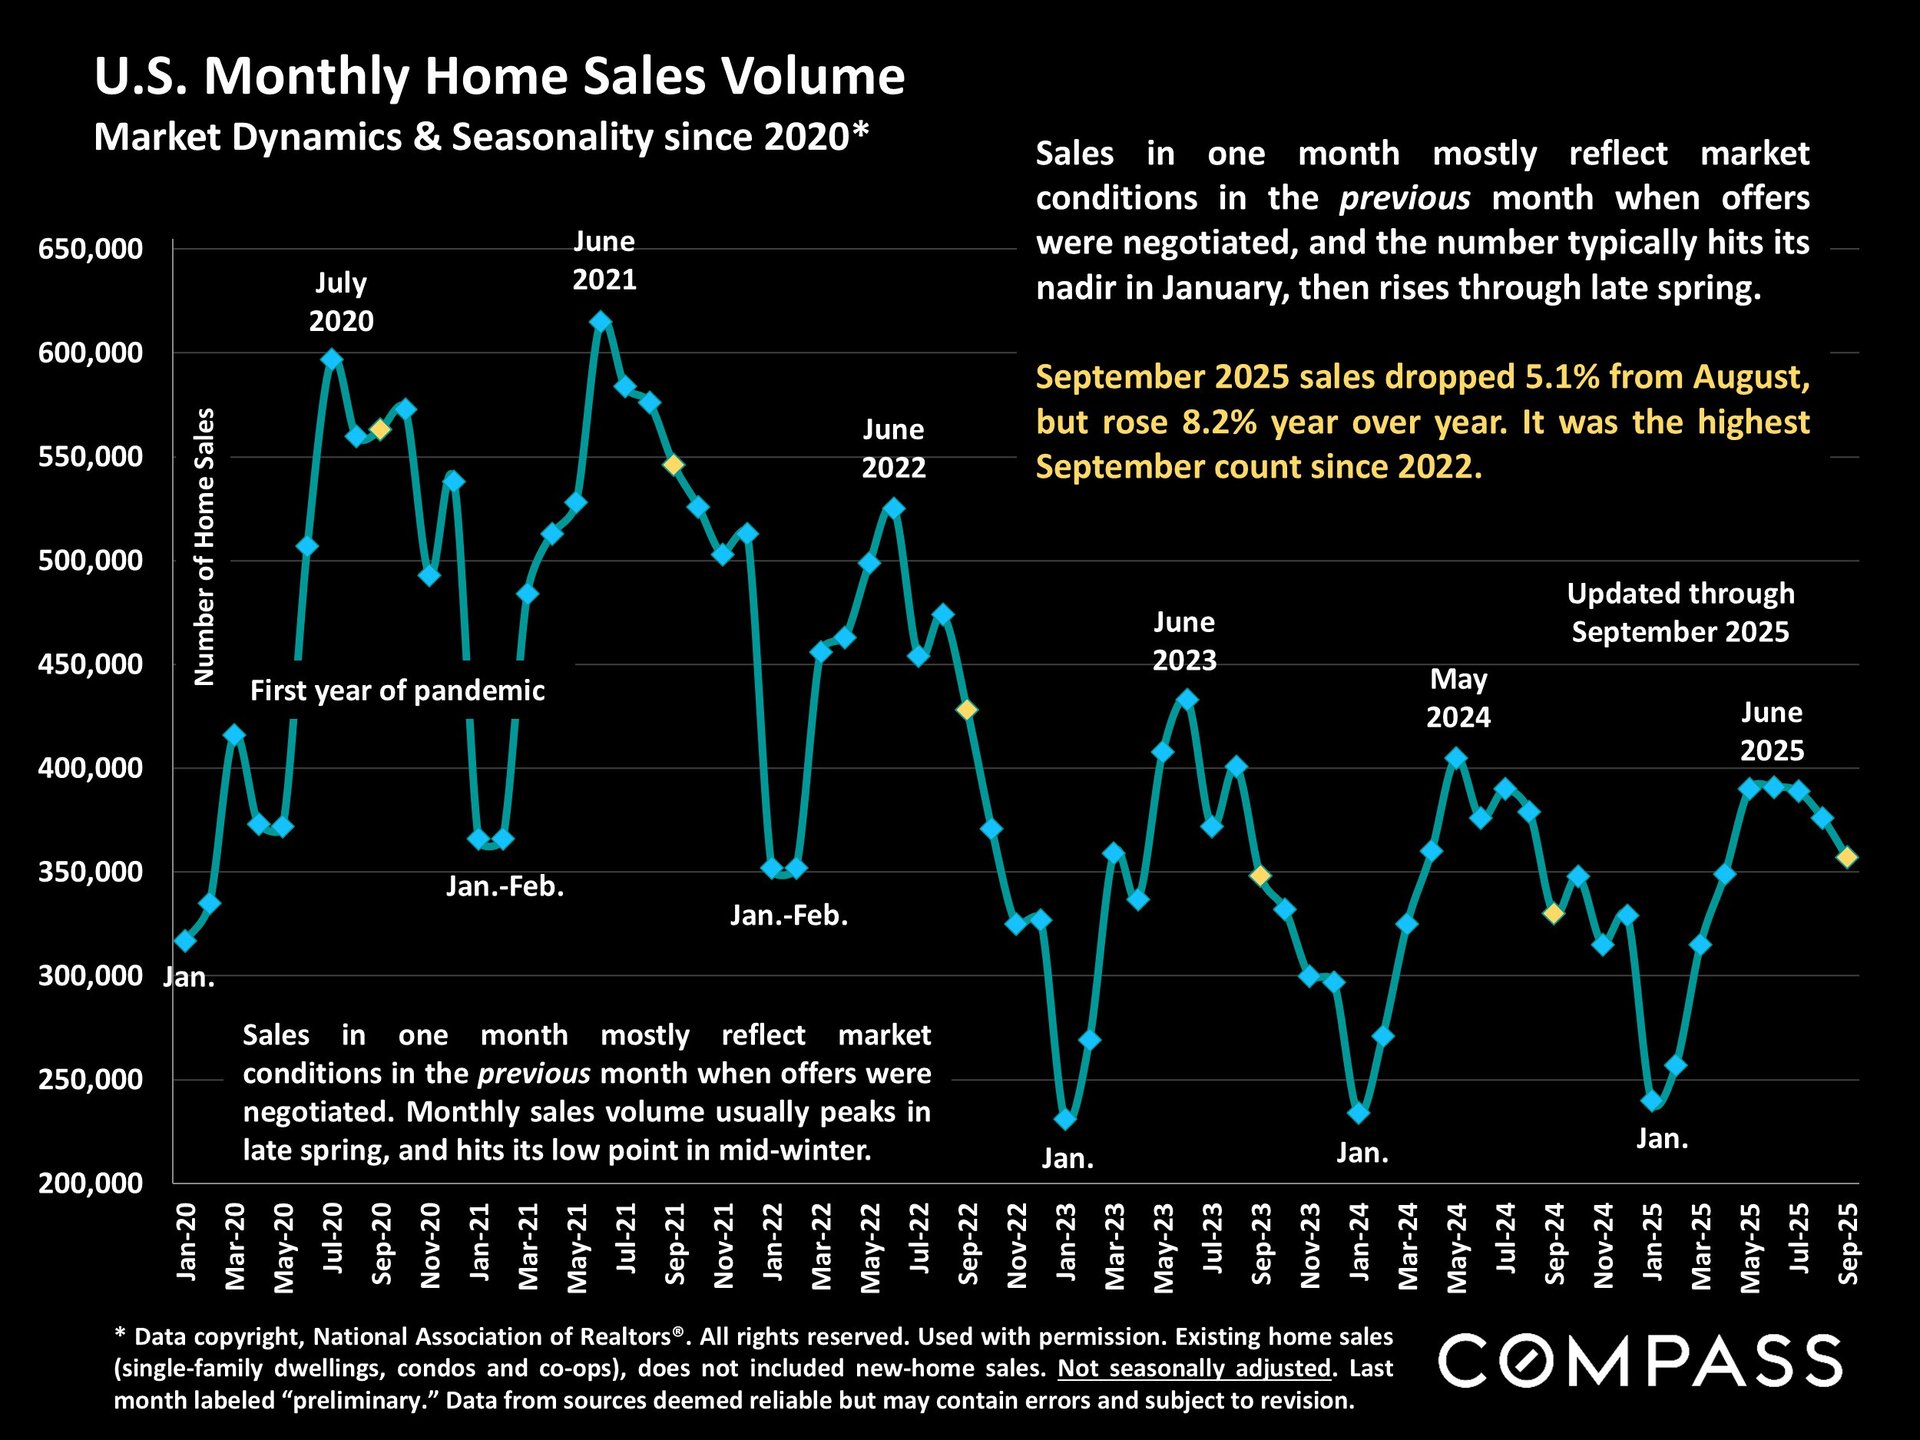
The number of home sales in September fell from August, which is the typical seasonal trend, but rose over 8% from September 2024. Home sales in one month mostly reflect market dynamics - as defined by listings going into contract - in the previous month, so we may see a rebound in sales in October and November due to the recent decline in interest rates.
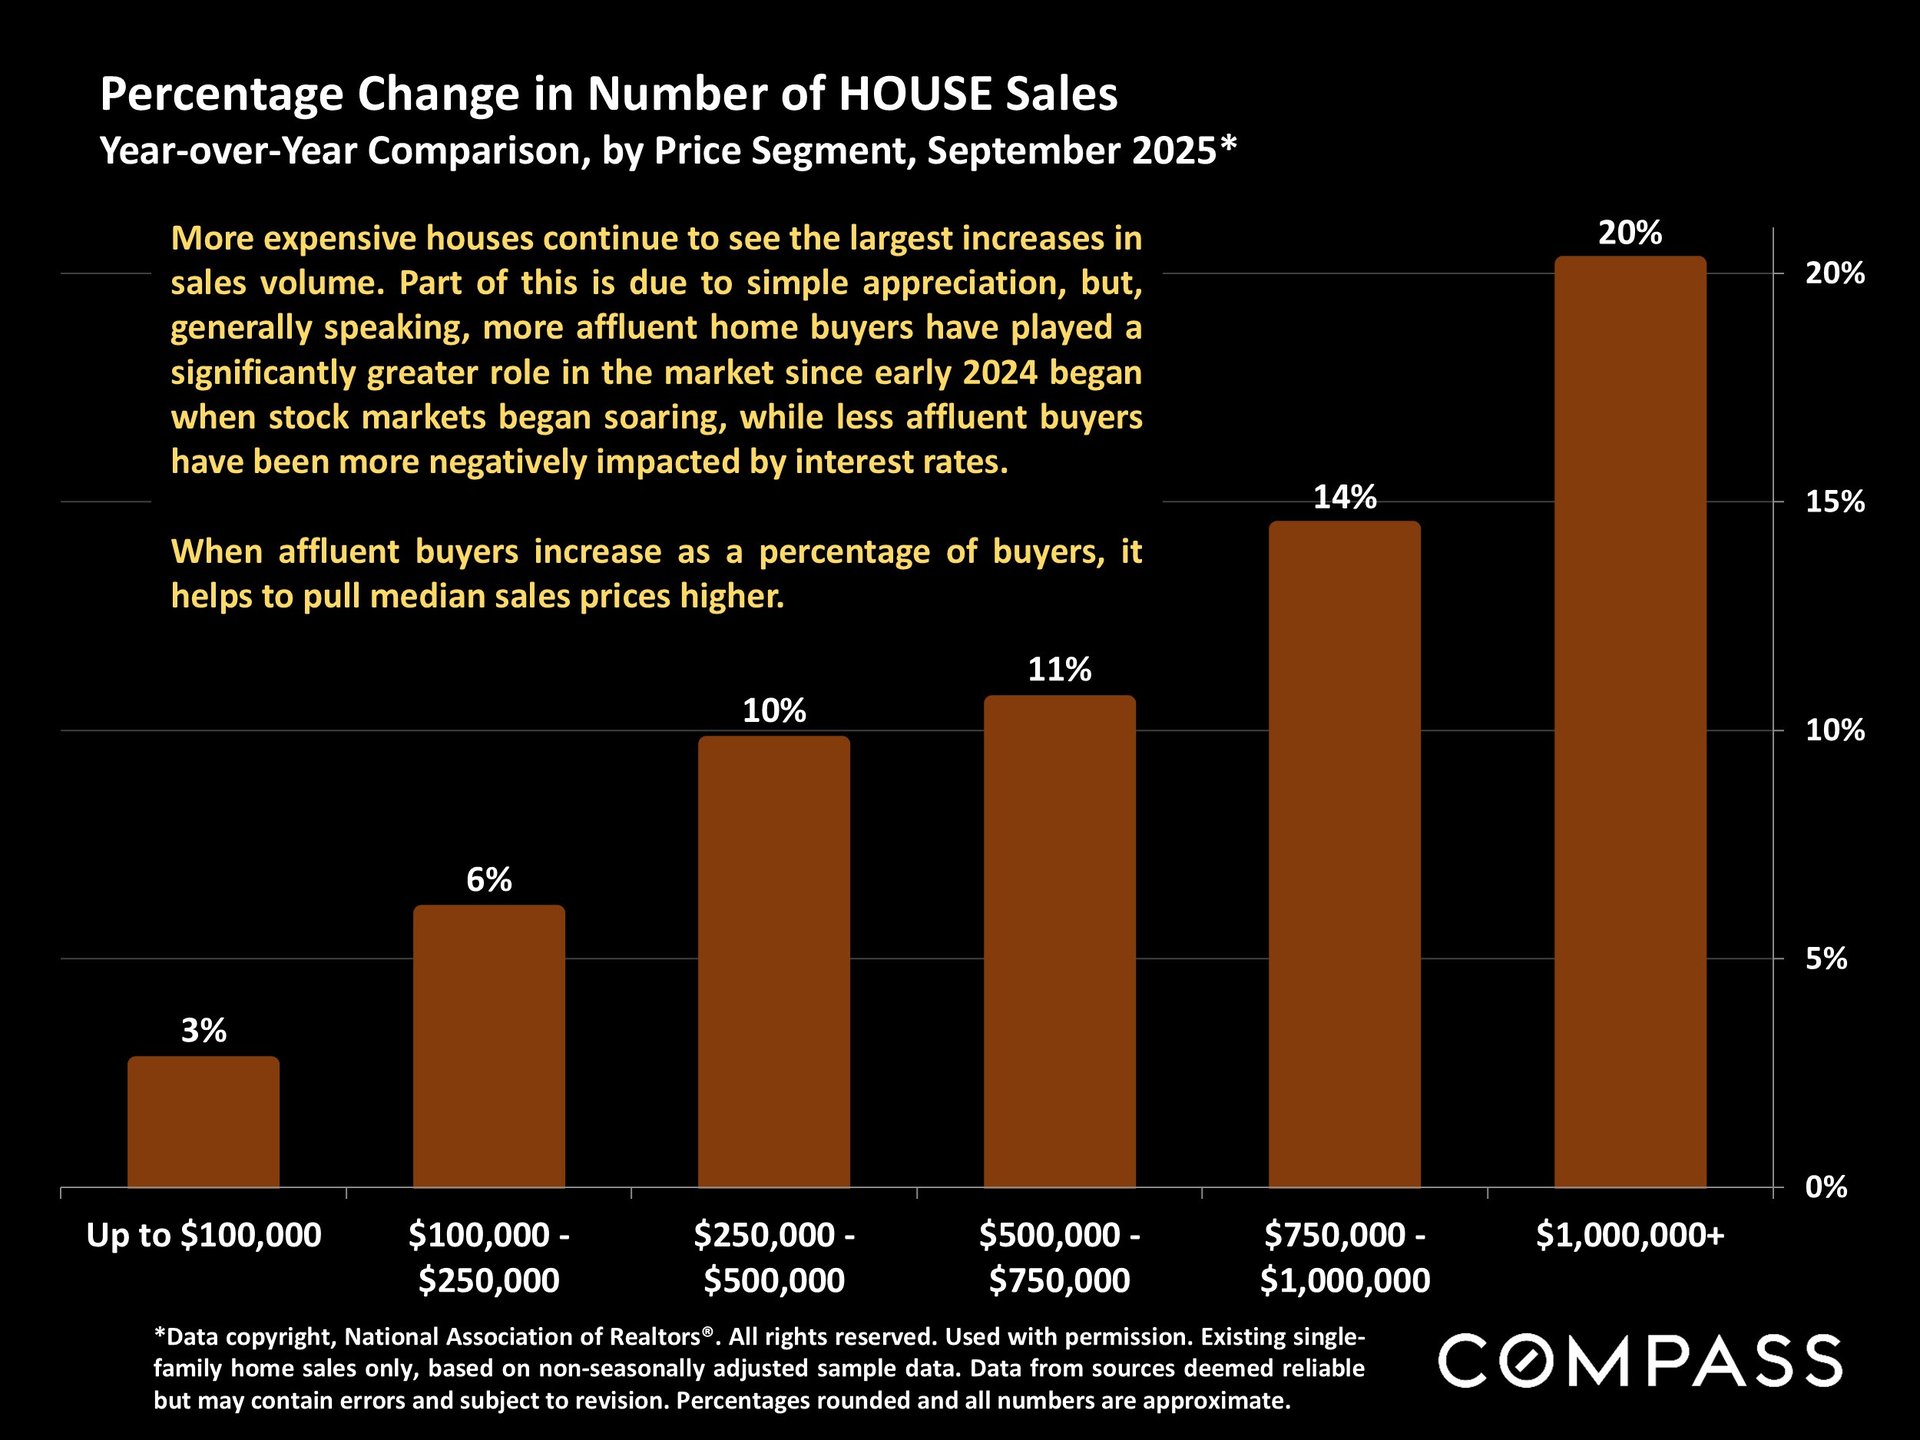
Higher-price home sales have been increasing more rapidly than in more affordable price segments. Since this chart reflects national home sales, it tops out at $1,000,000+, but, generally speaking, this dynamic of more affluent buyers playing a larger role in demand has been playing out in markets across the country, whatever the price point. In some very expensive markets, the biggest year-over-year increases in sales have been of homes selling for $5,000,000+.
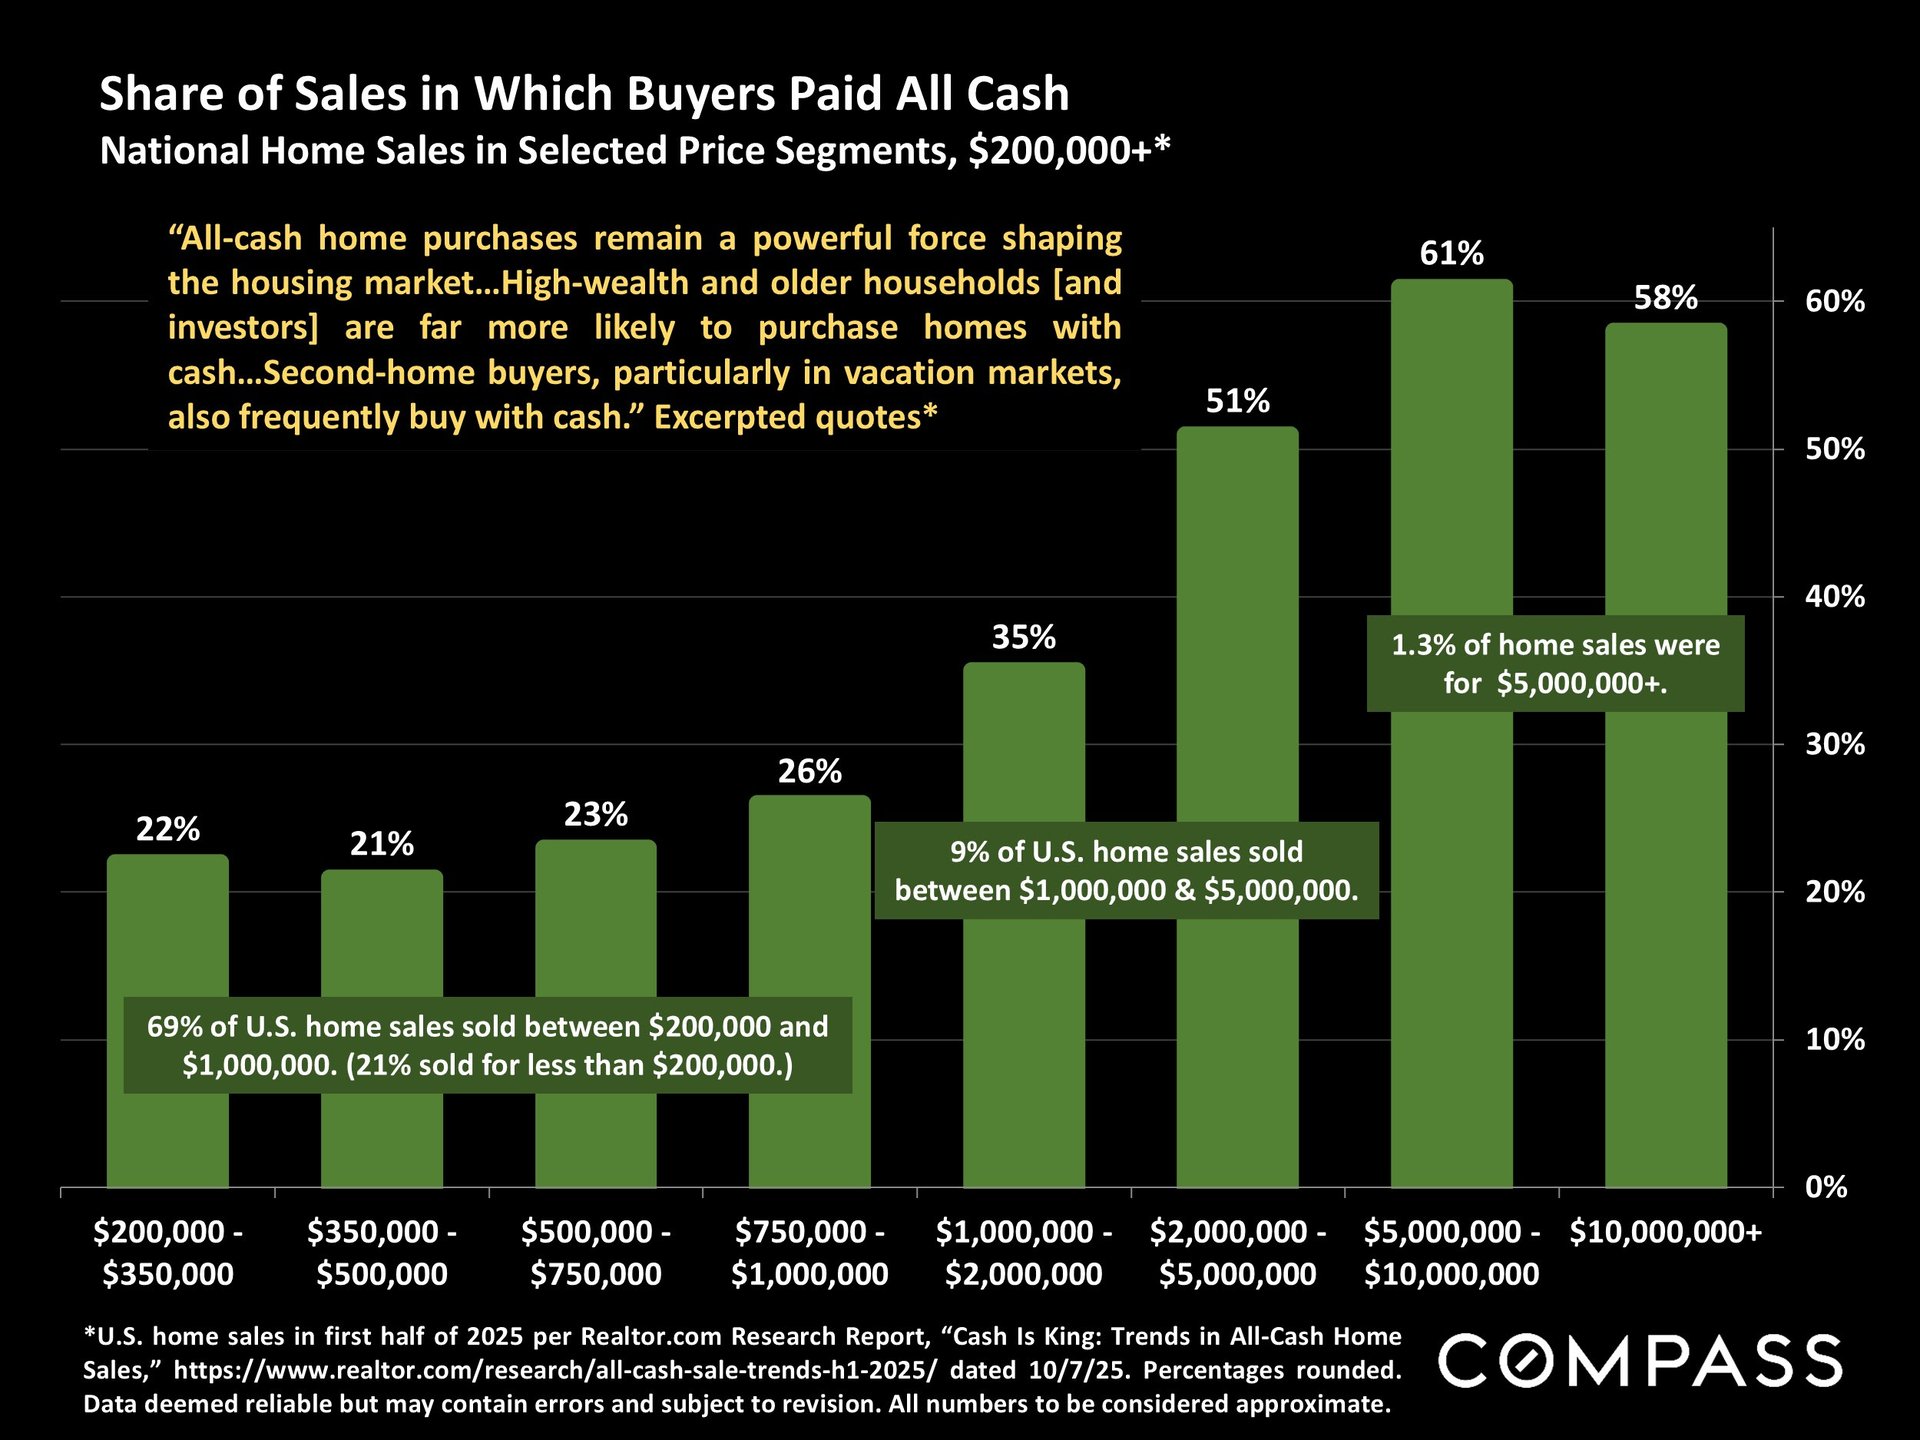
Above the $200,000 price threshold, the more expensive the home, the more likely it was to sell for all cash. According to this study, more than half of all homes selling for $2 million+ have sold without financing.
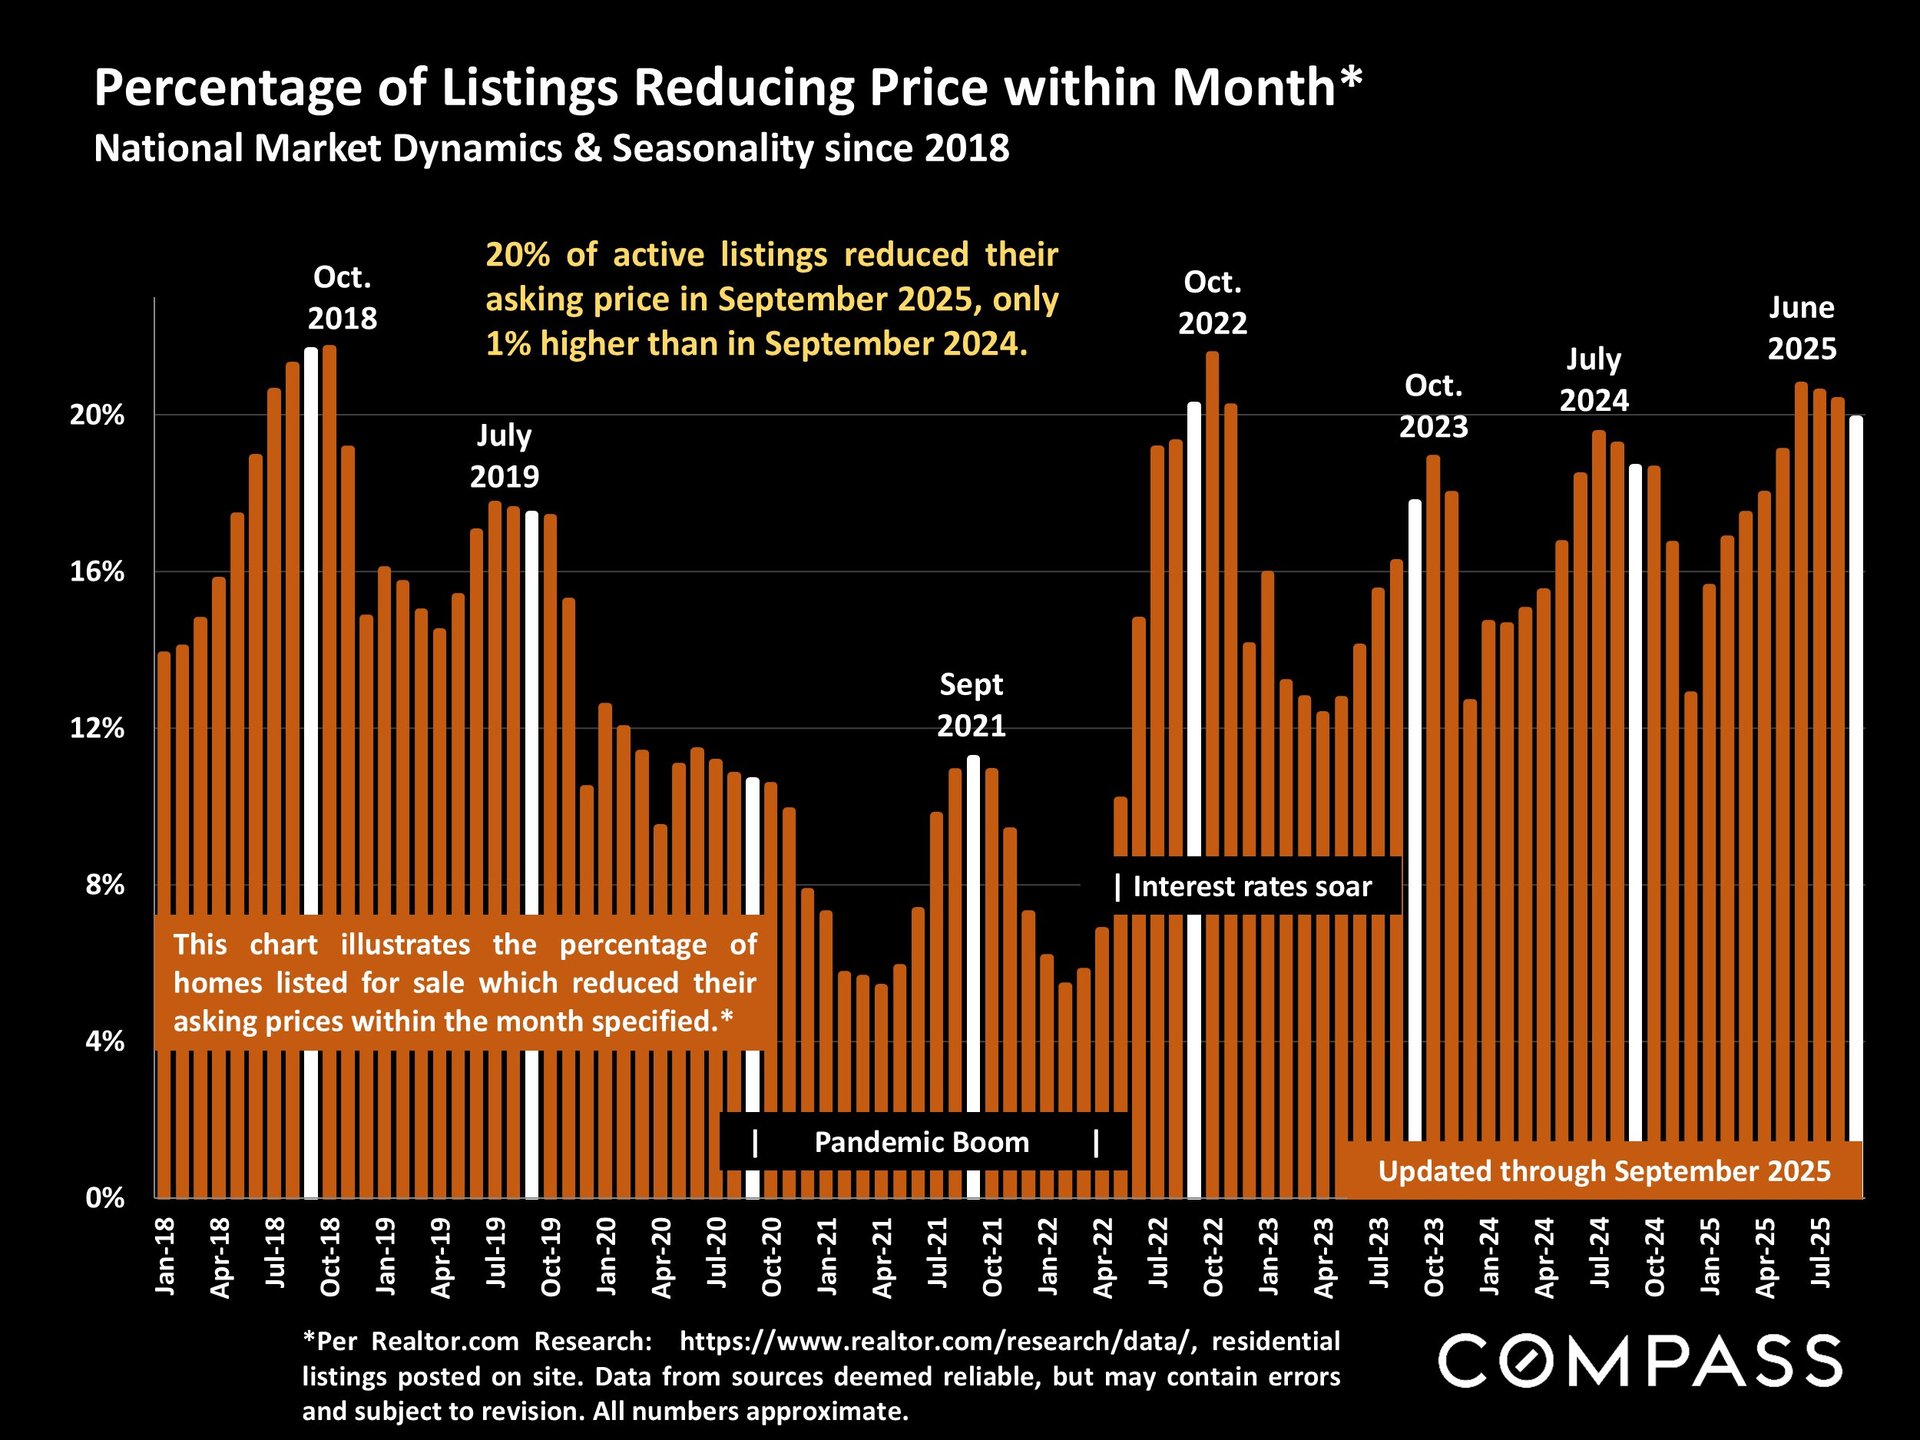
This chart illustrates the percentage of active listings which reduced their asking price within the month. Both the number of price reductions (not illustrated here) and the percentage of listings reducing price have been dropping since peaking in June.
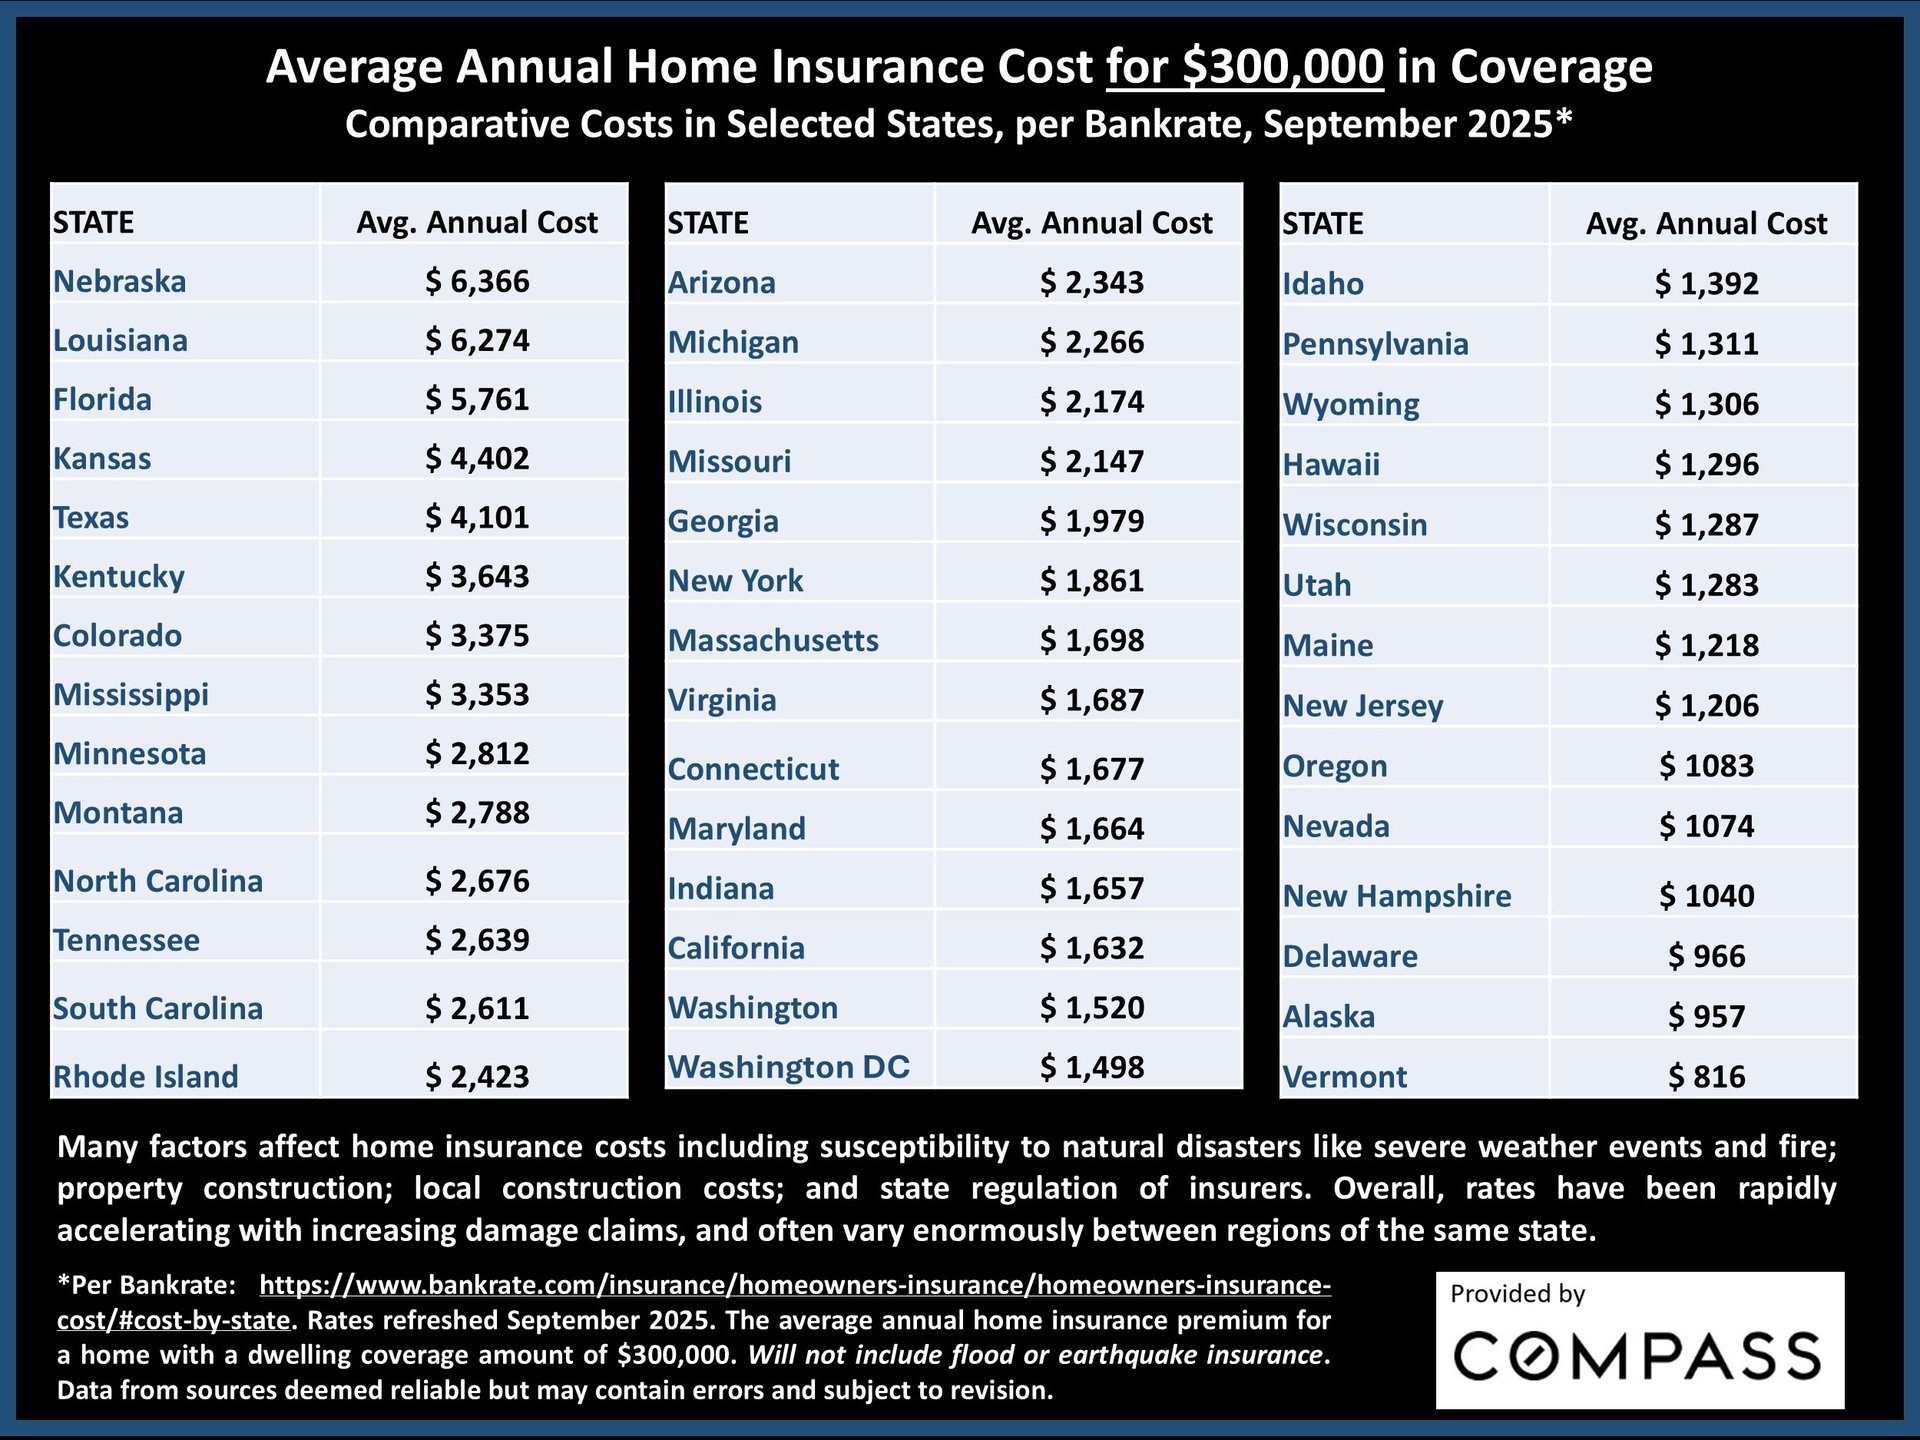
A look at average annual homeowner's insurance costs in selected states, based on $300,000 in coverage. In the great majority of states, average premiums have increased rapidly in 2025, and, unfortunately, appear poised to continue to do so. Rates vary widely between and within states due to a number of factors such as susceptibility to severe weather events and fire, property construction, local construction costs, and state regulation of insurers.