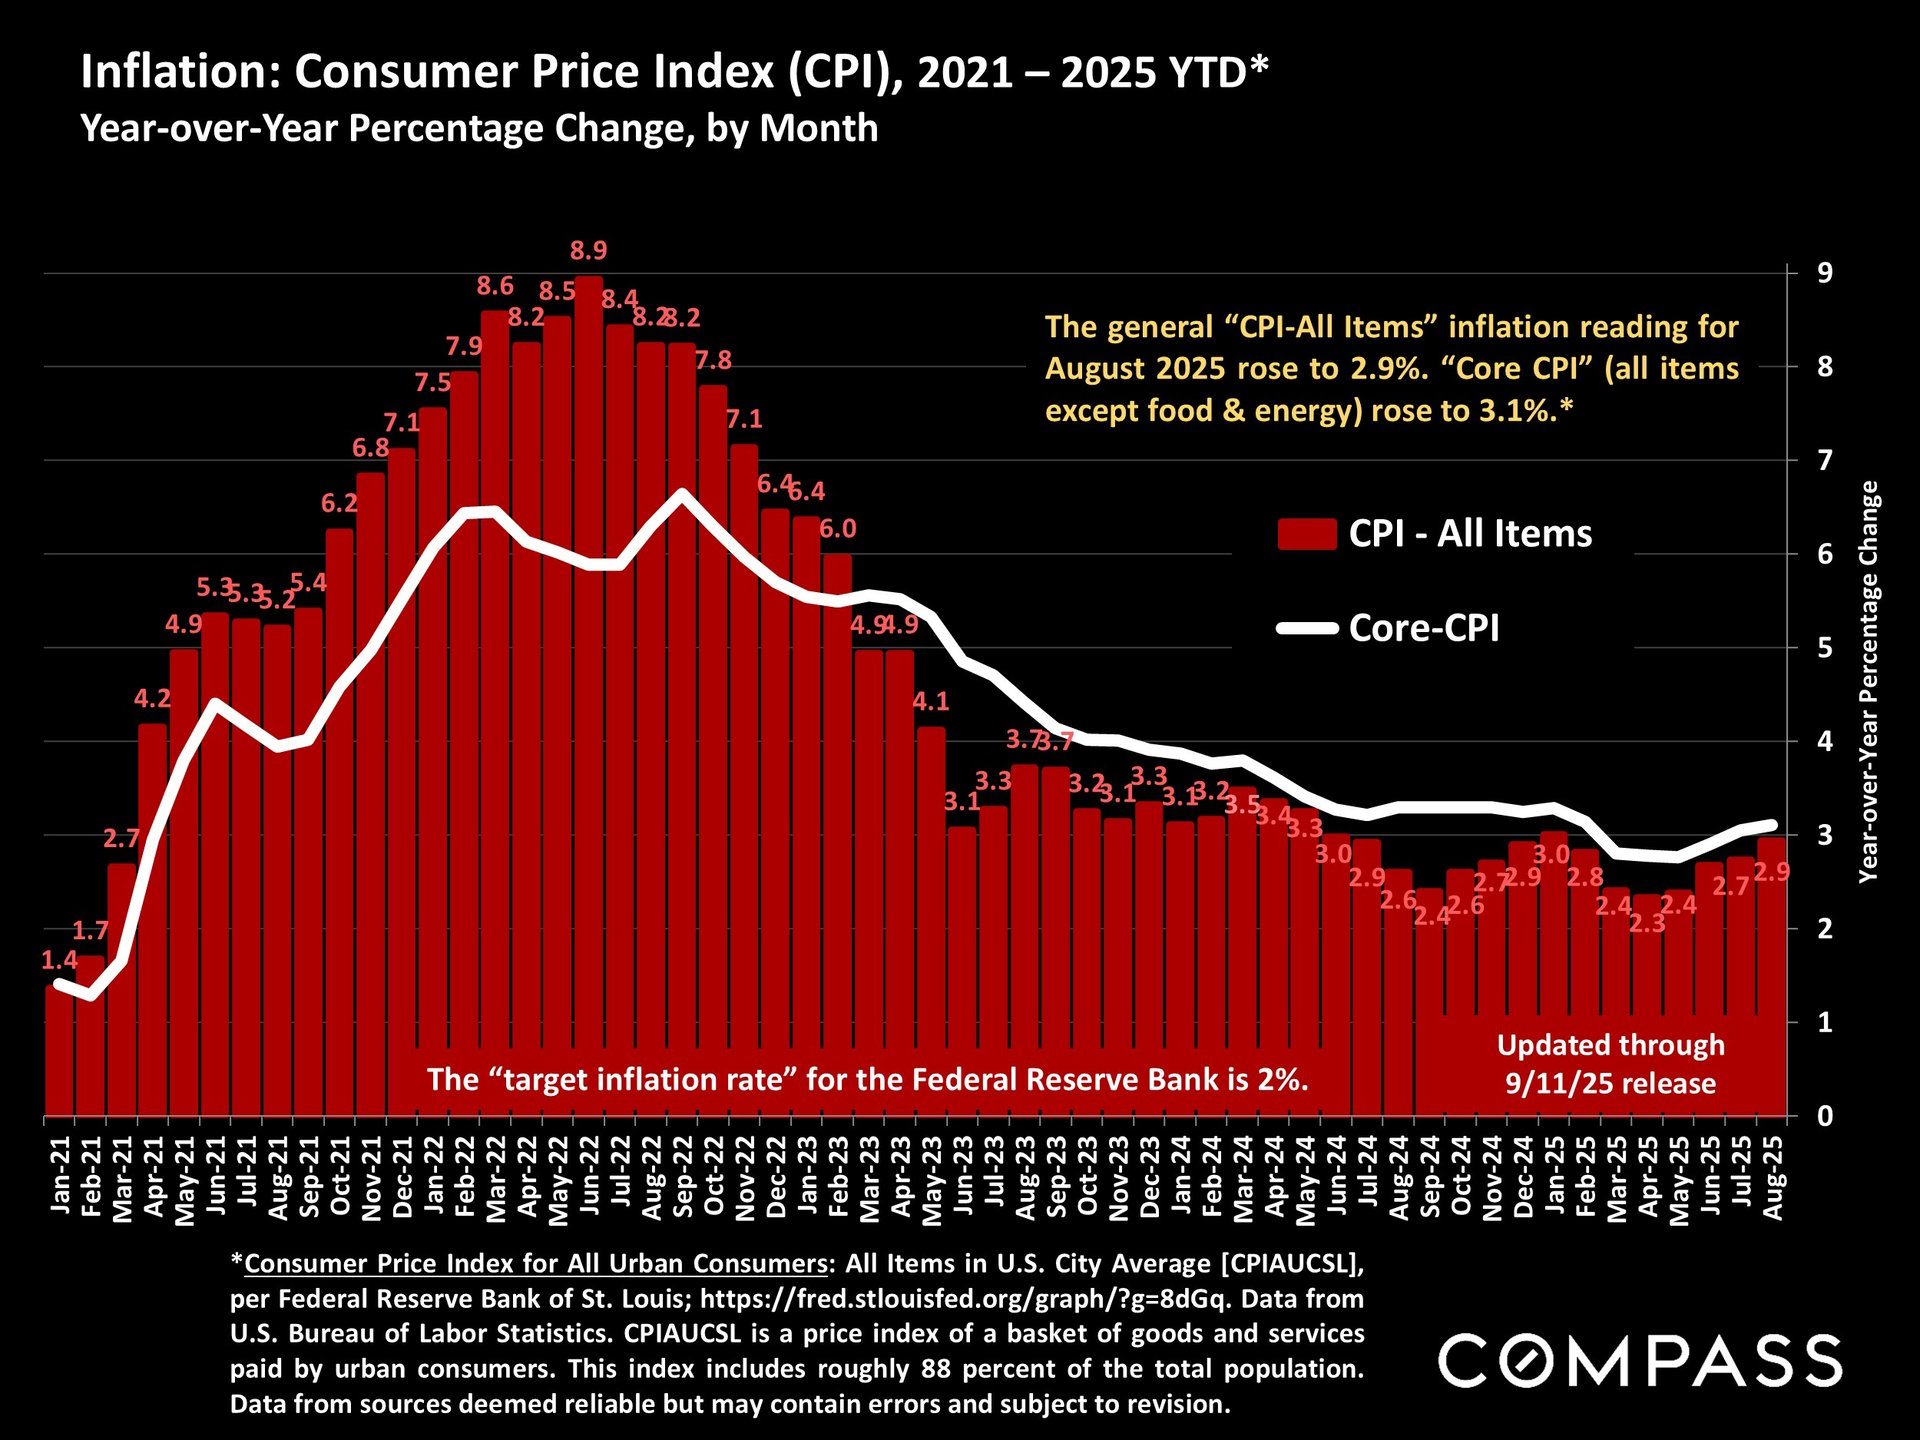
Inflation - CPI-All Items - ticked up in yesterday's reading from 2.7% to 2.9%, but investors don't believe the increase was enough to derail expectations that the Fed will reduce its benchmark rate - probably .25% to .5% - later this month. Last year at this time, when the Fed made their first rate reduction in years, the size of the decrease disappointed investors, and interest rates unexpectedly rebounded (much) higher. (See interest rate chart after the inflation charts).
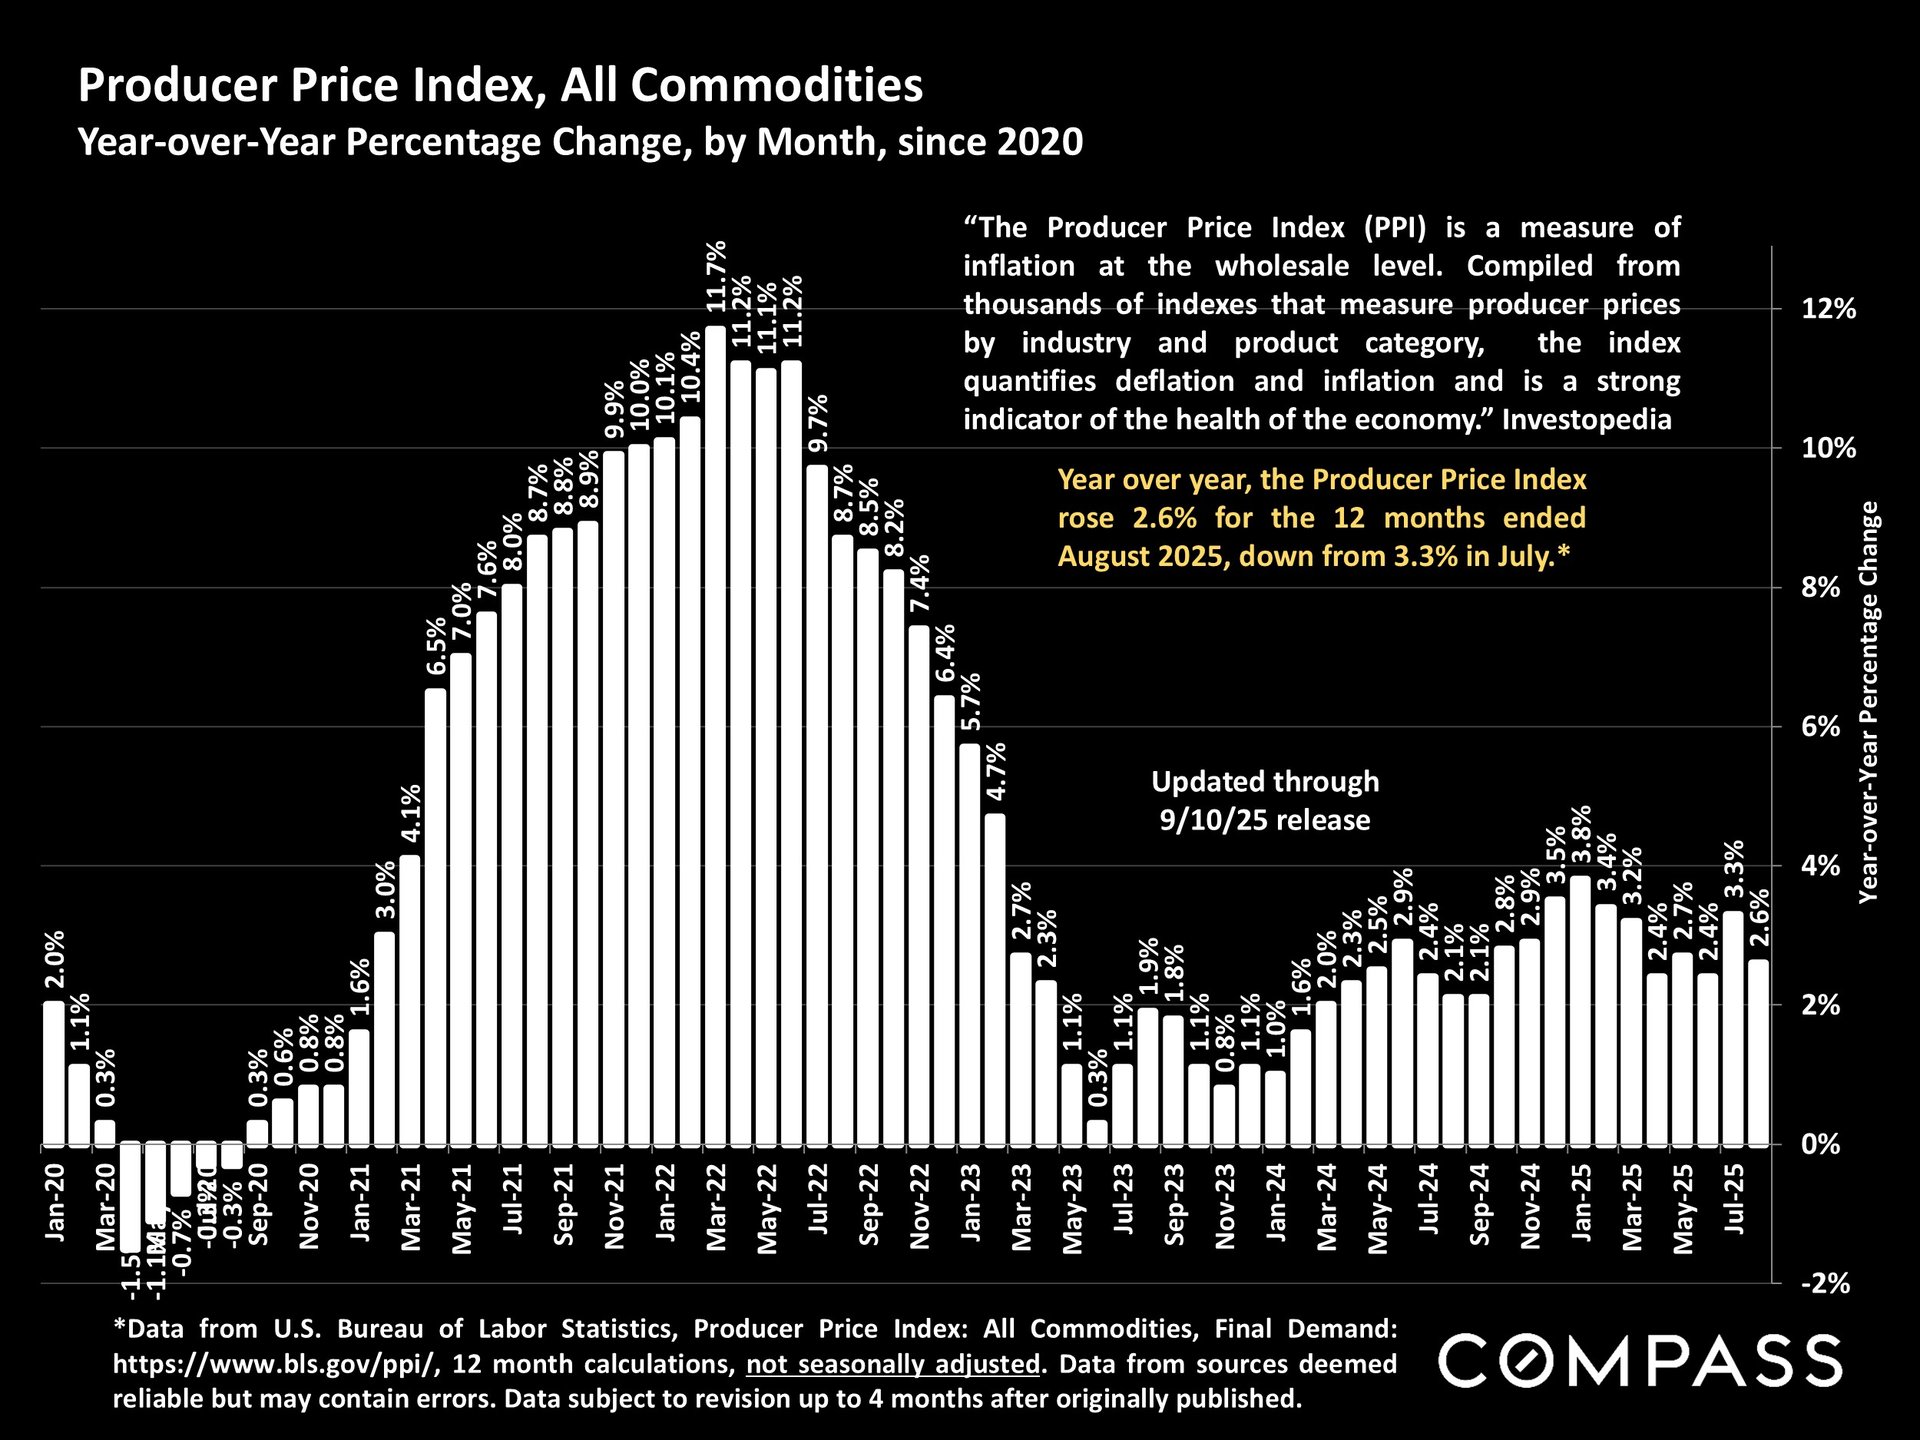
For those who like to dive deeper, below is a chart on the Producer Price Index, a measurement of wholesale inflation. August saw a 2.6% year-over-year increase, declining from an unexpectedly high 3.3% rise in July.
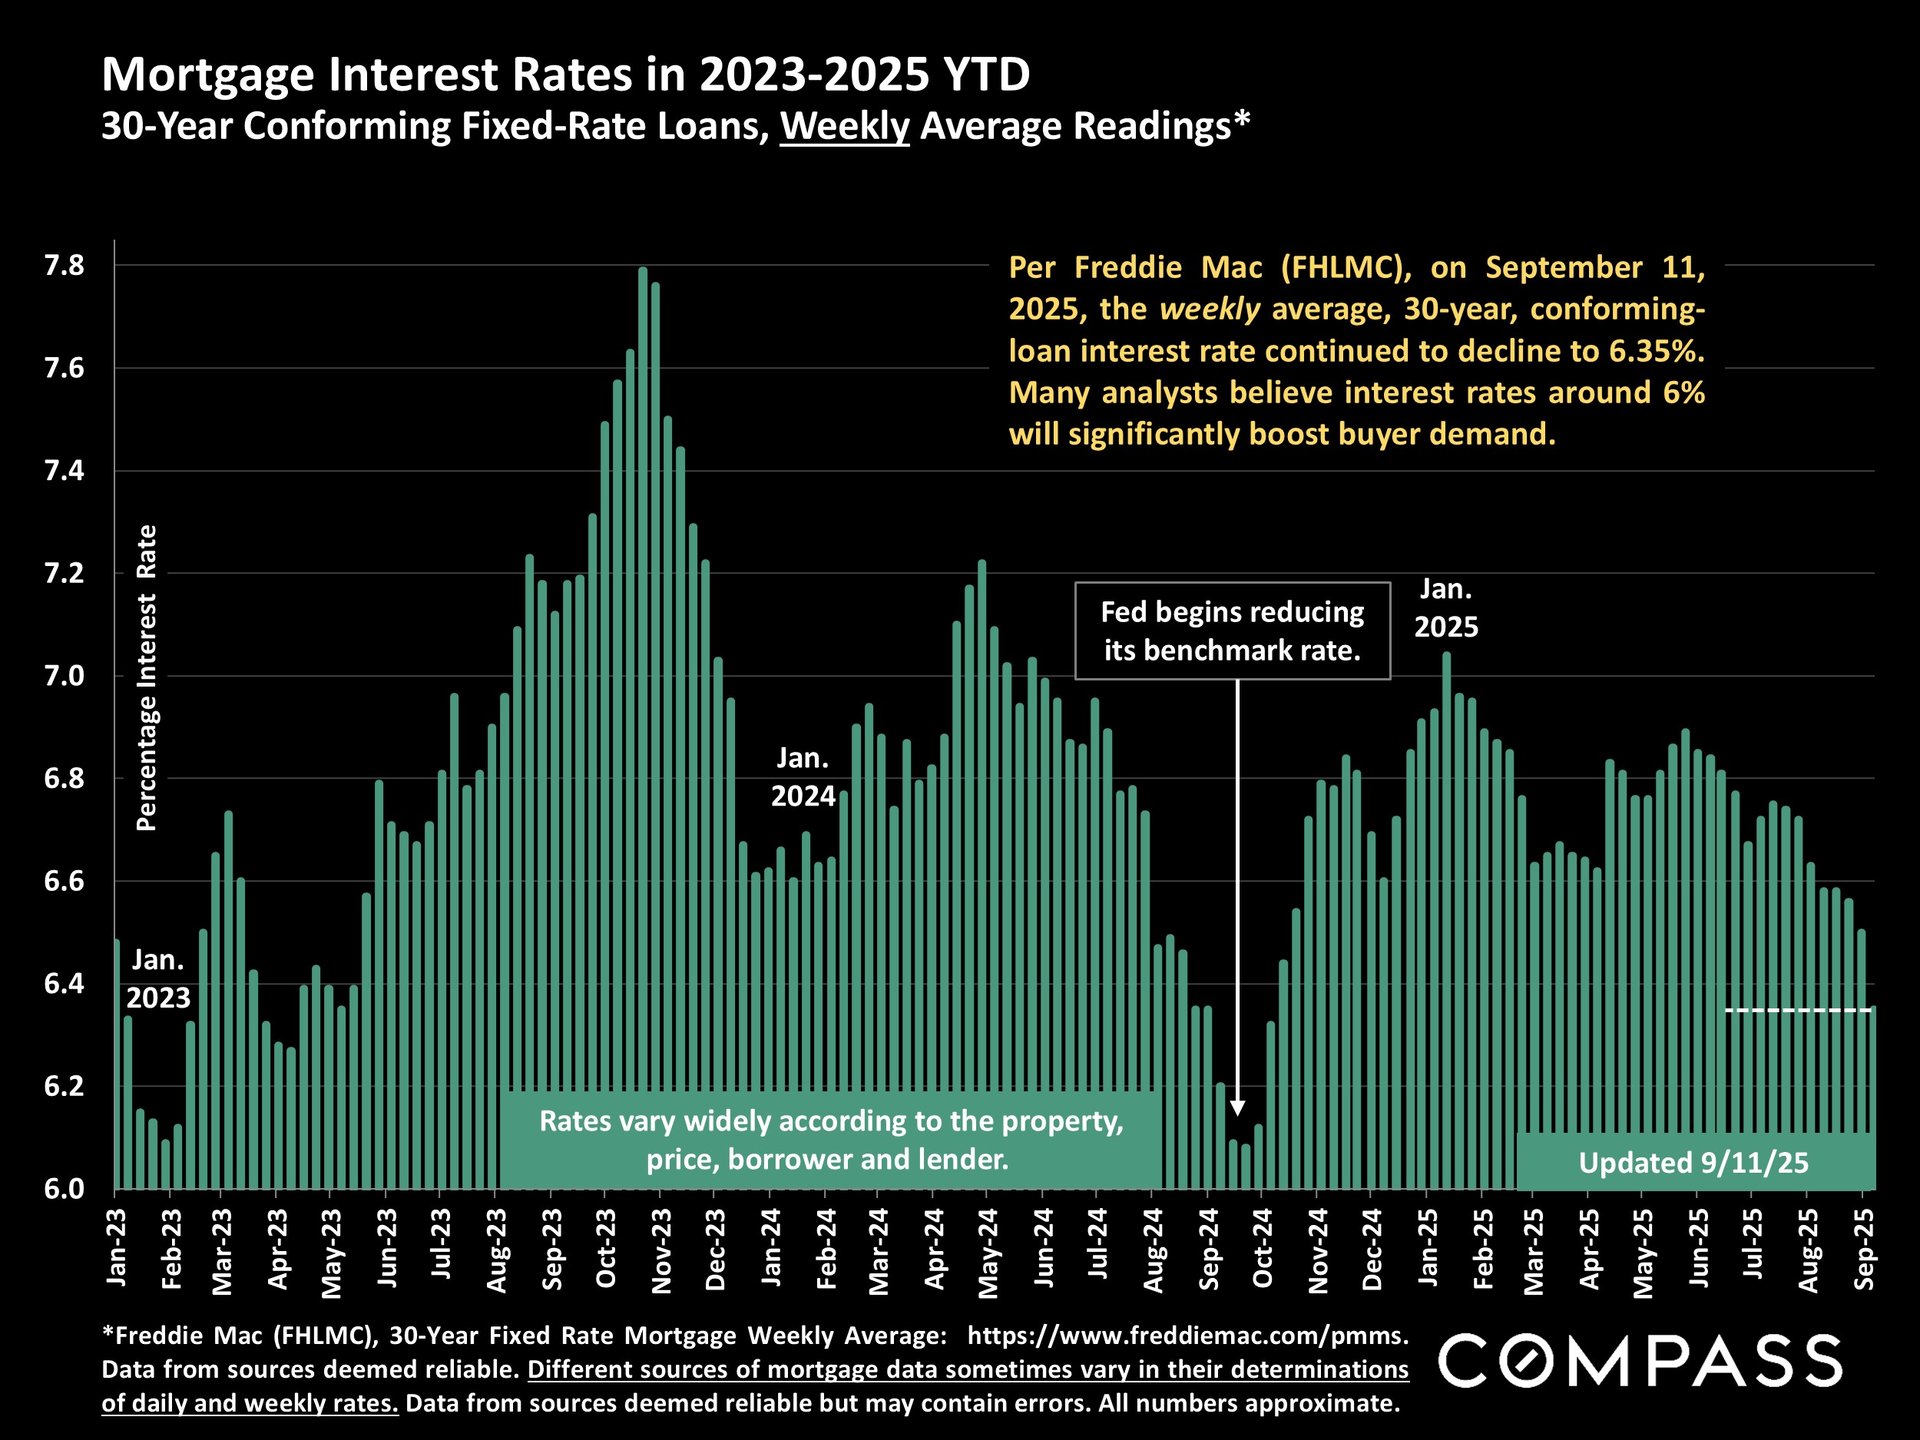
Interest rates continue to decline, getting closer to the 6% range many analysts believe will significantly boost buyer demand.
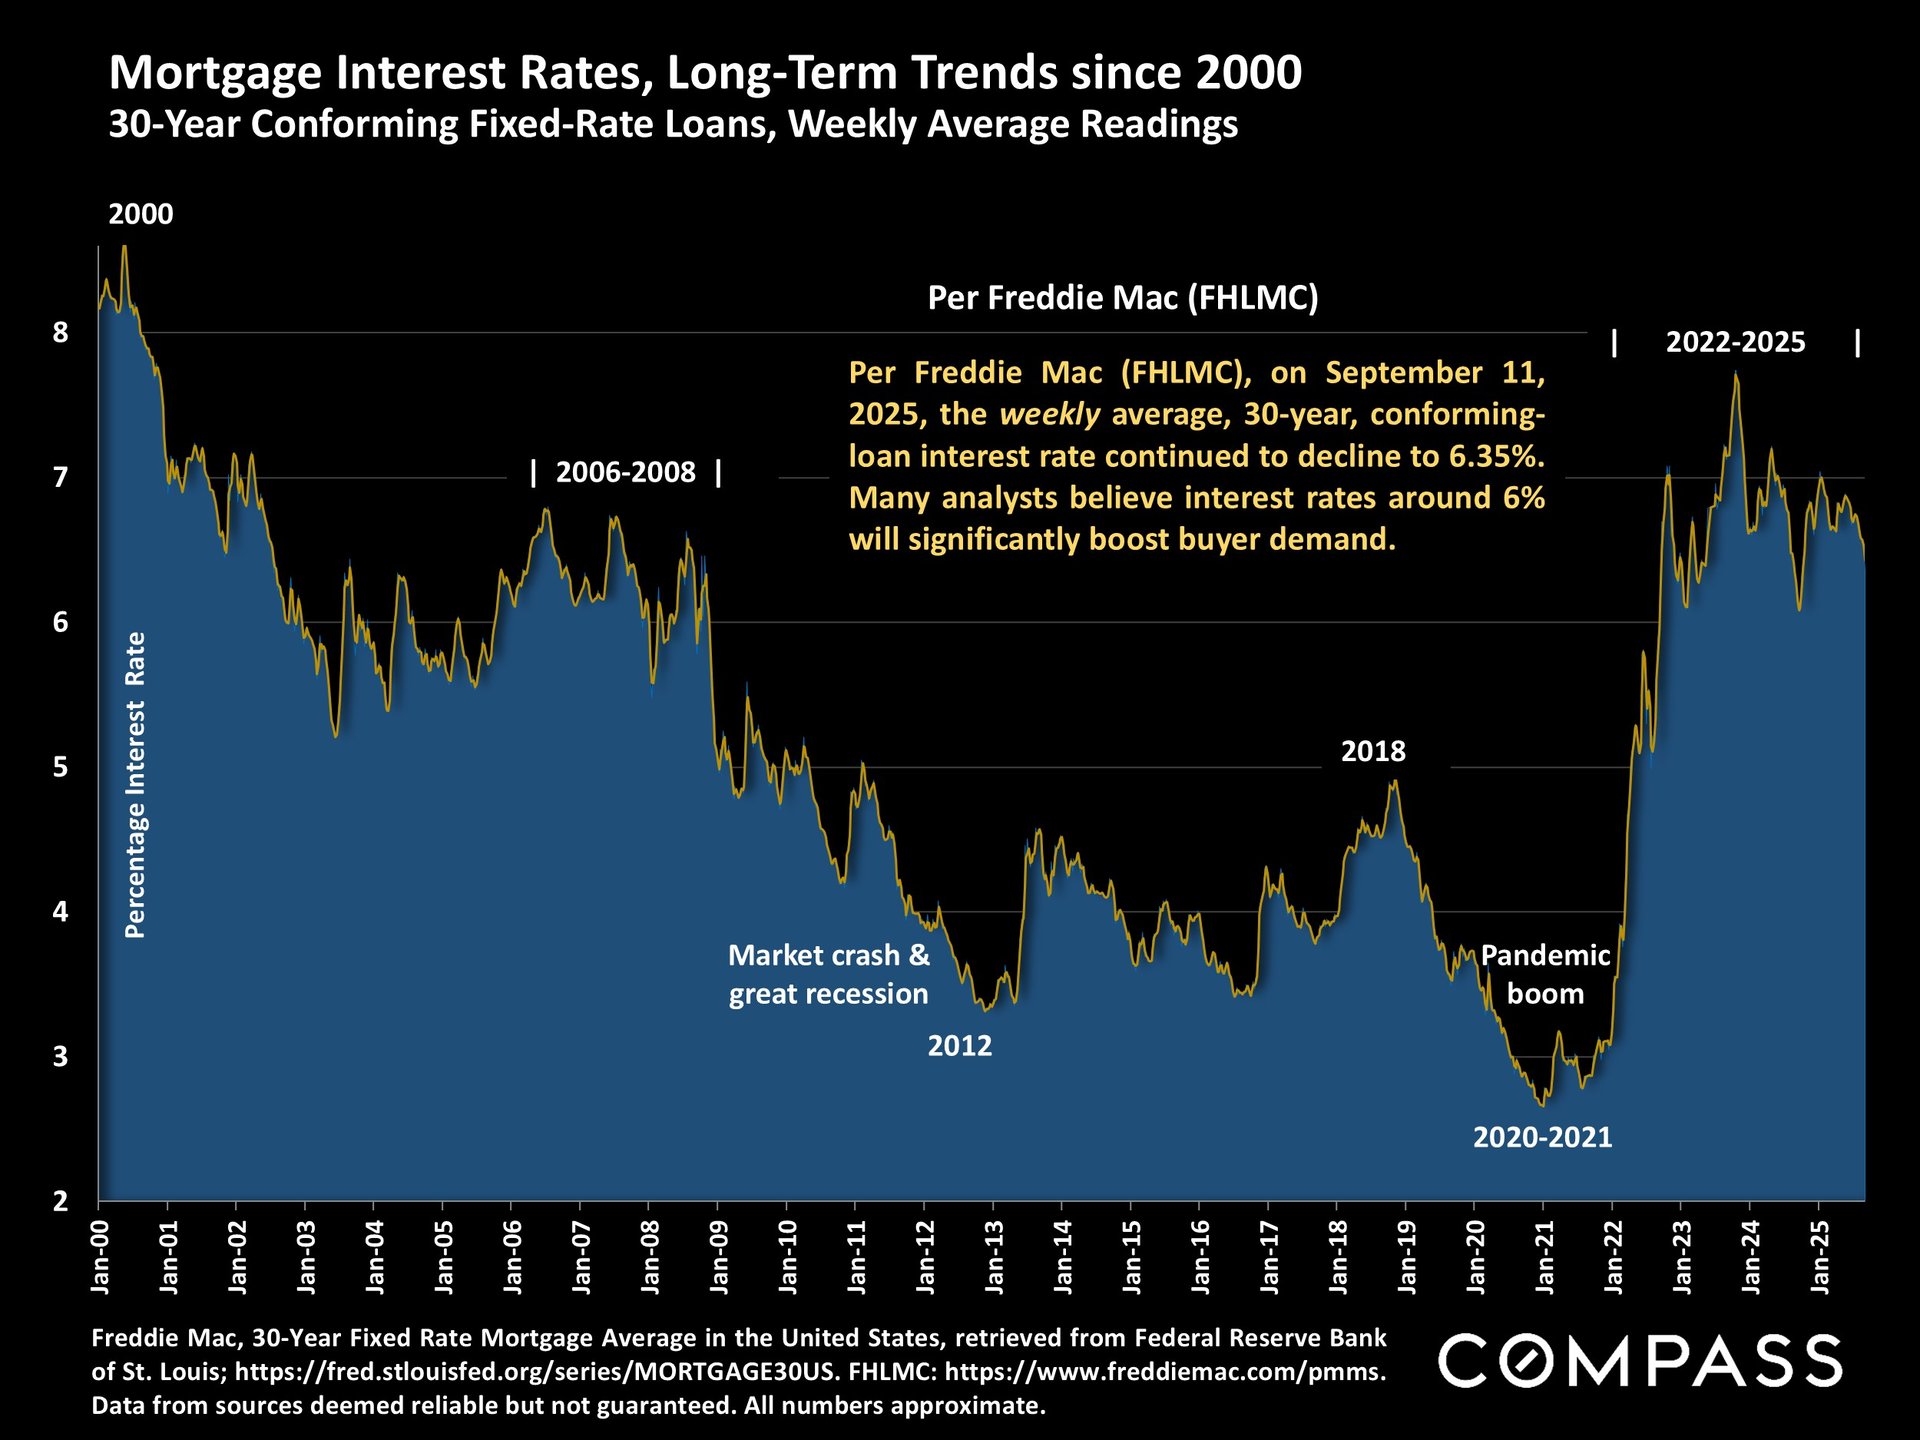
Longer-term interest rate chart:
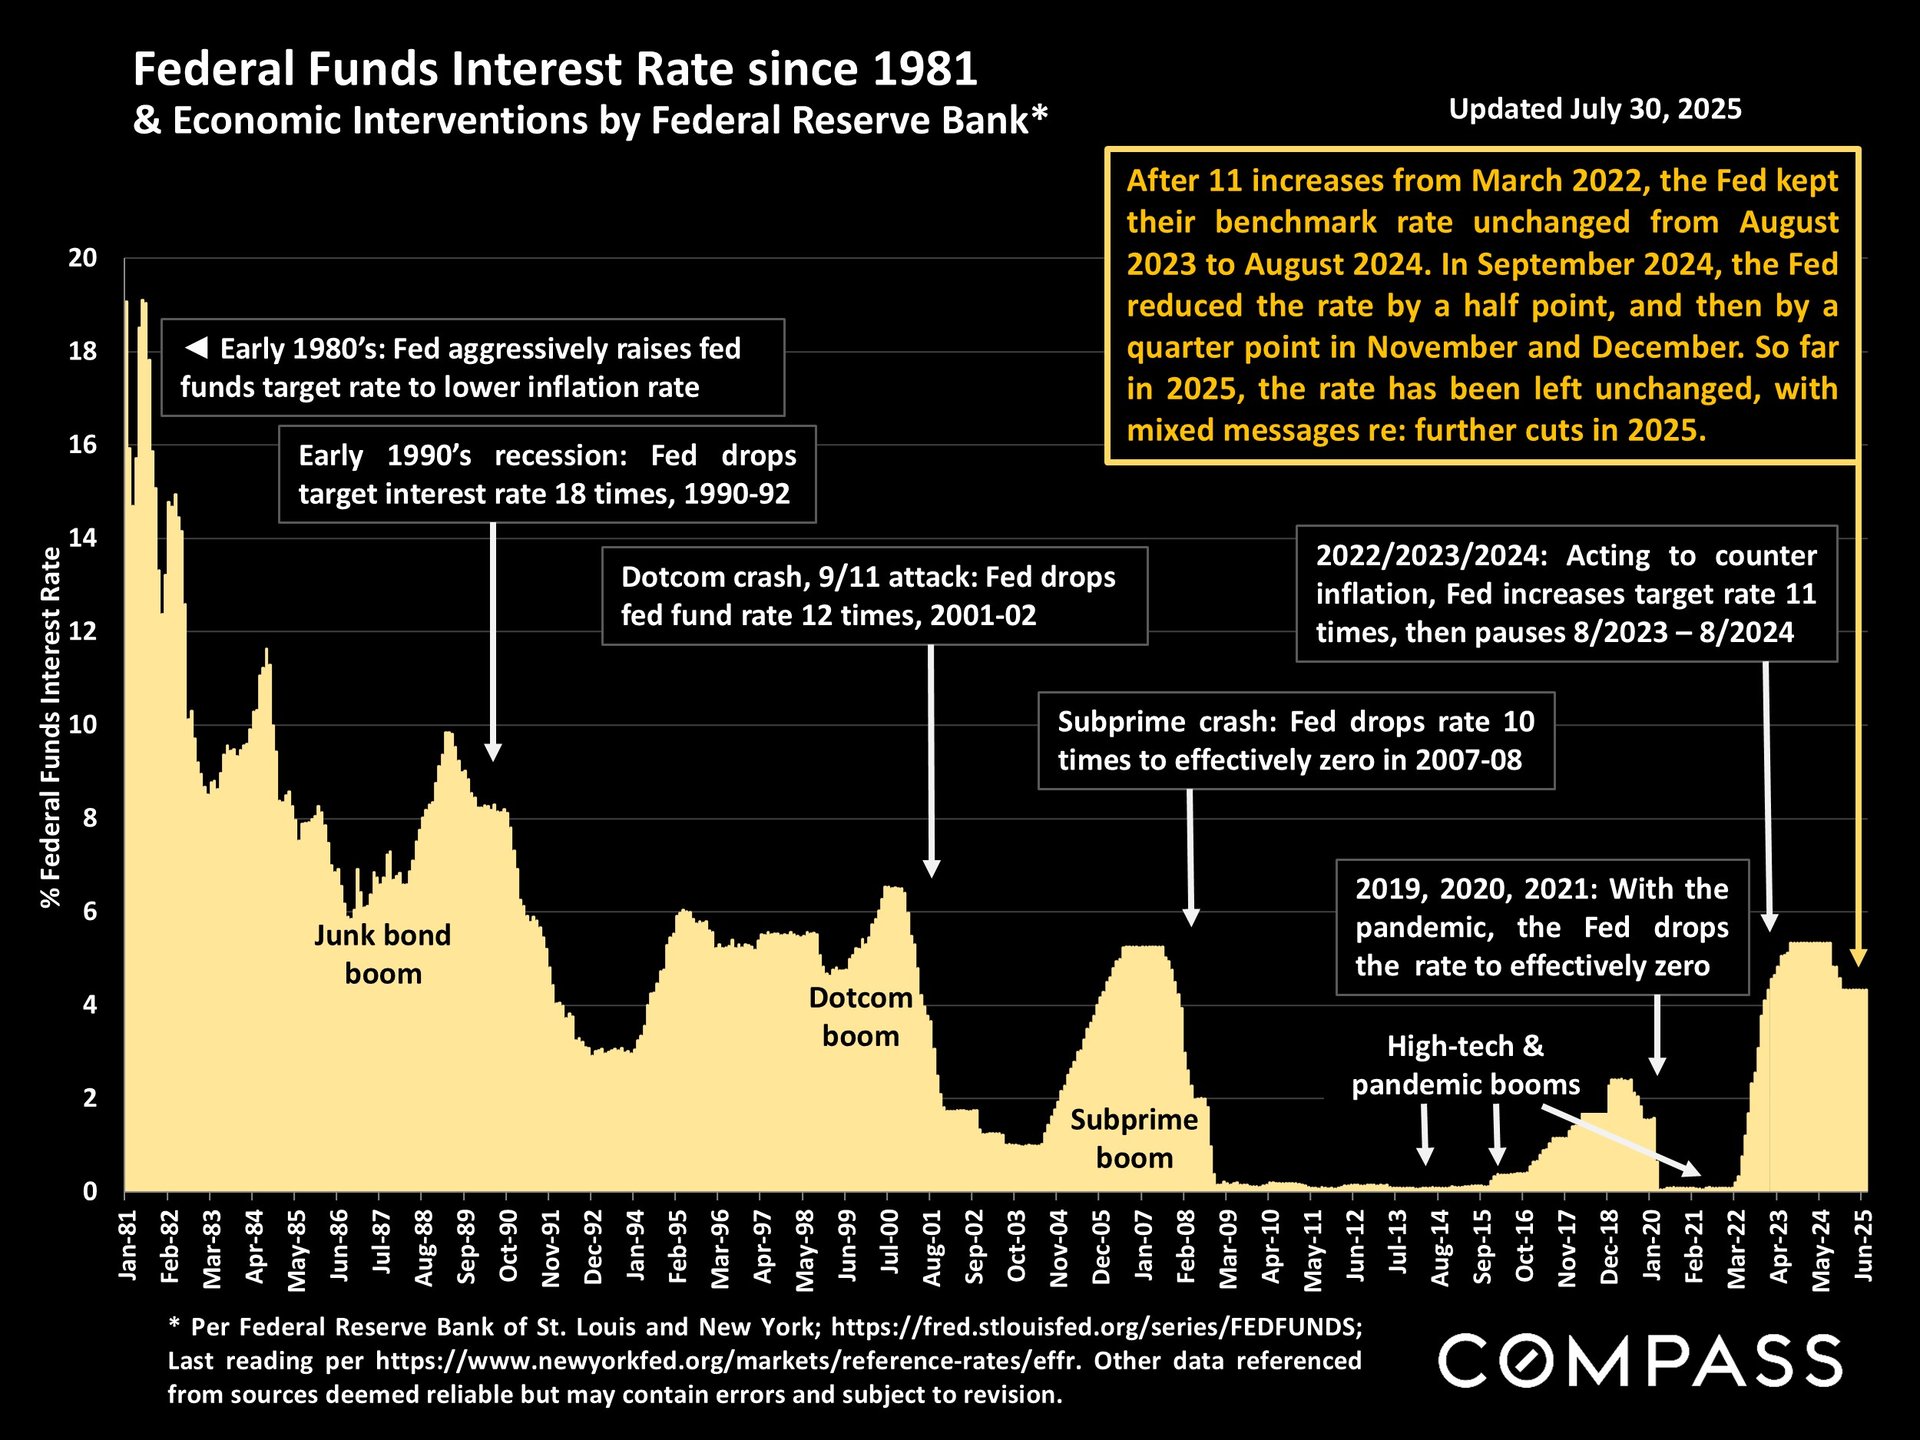
A long-term look at the Fed's benchmark rate changes:
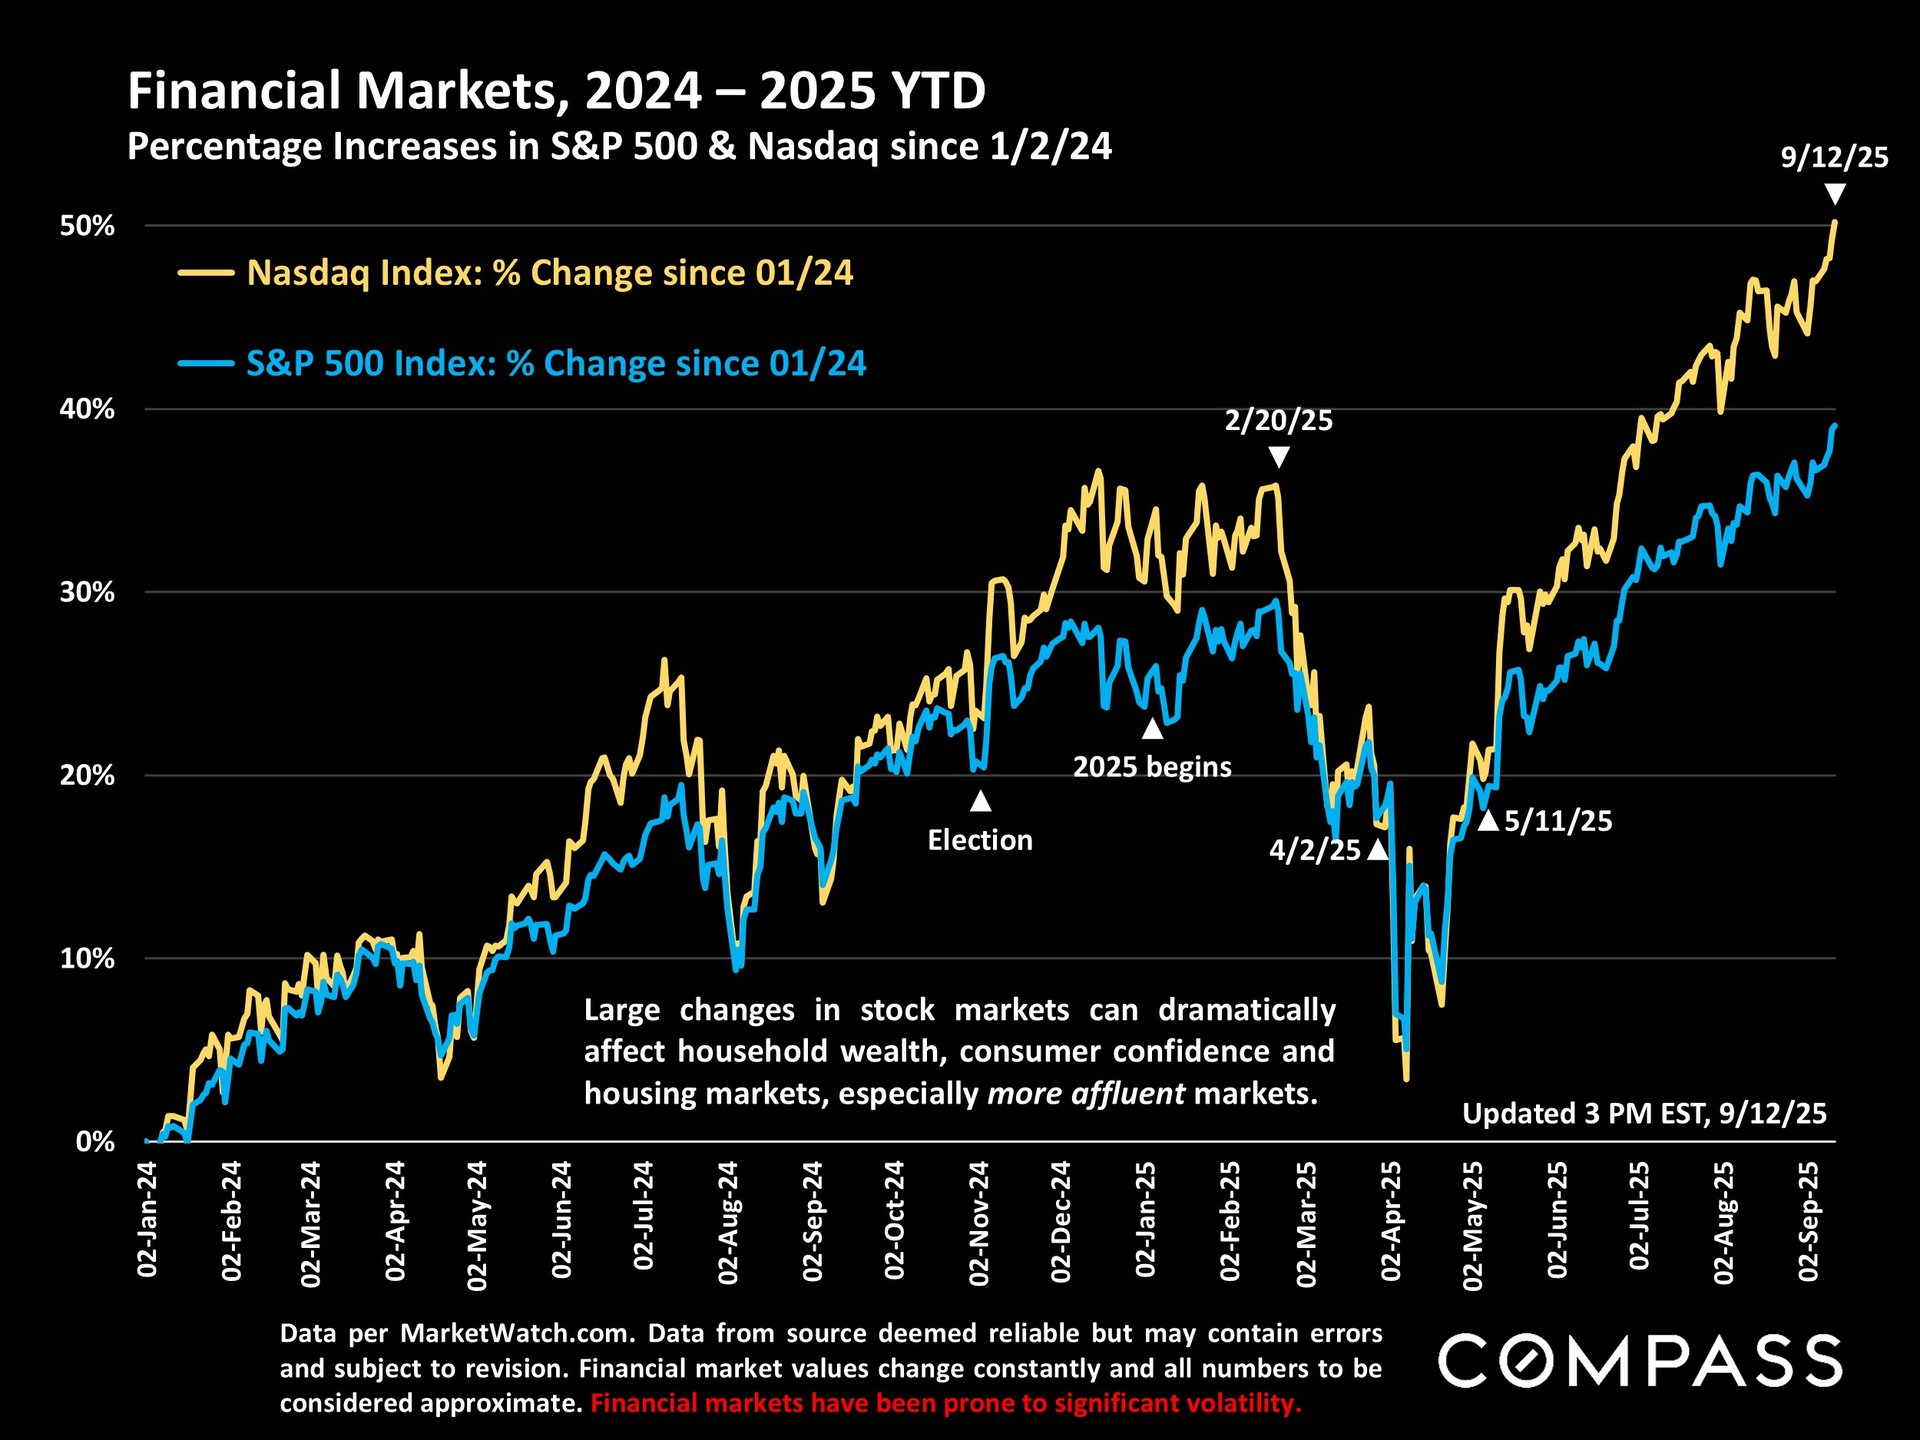
Marked by virtually non-stop exuberance, stock markets continue to hit successive new highs.
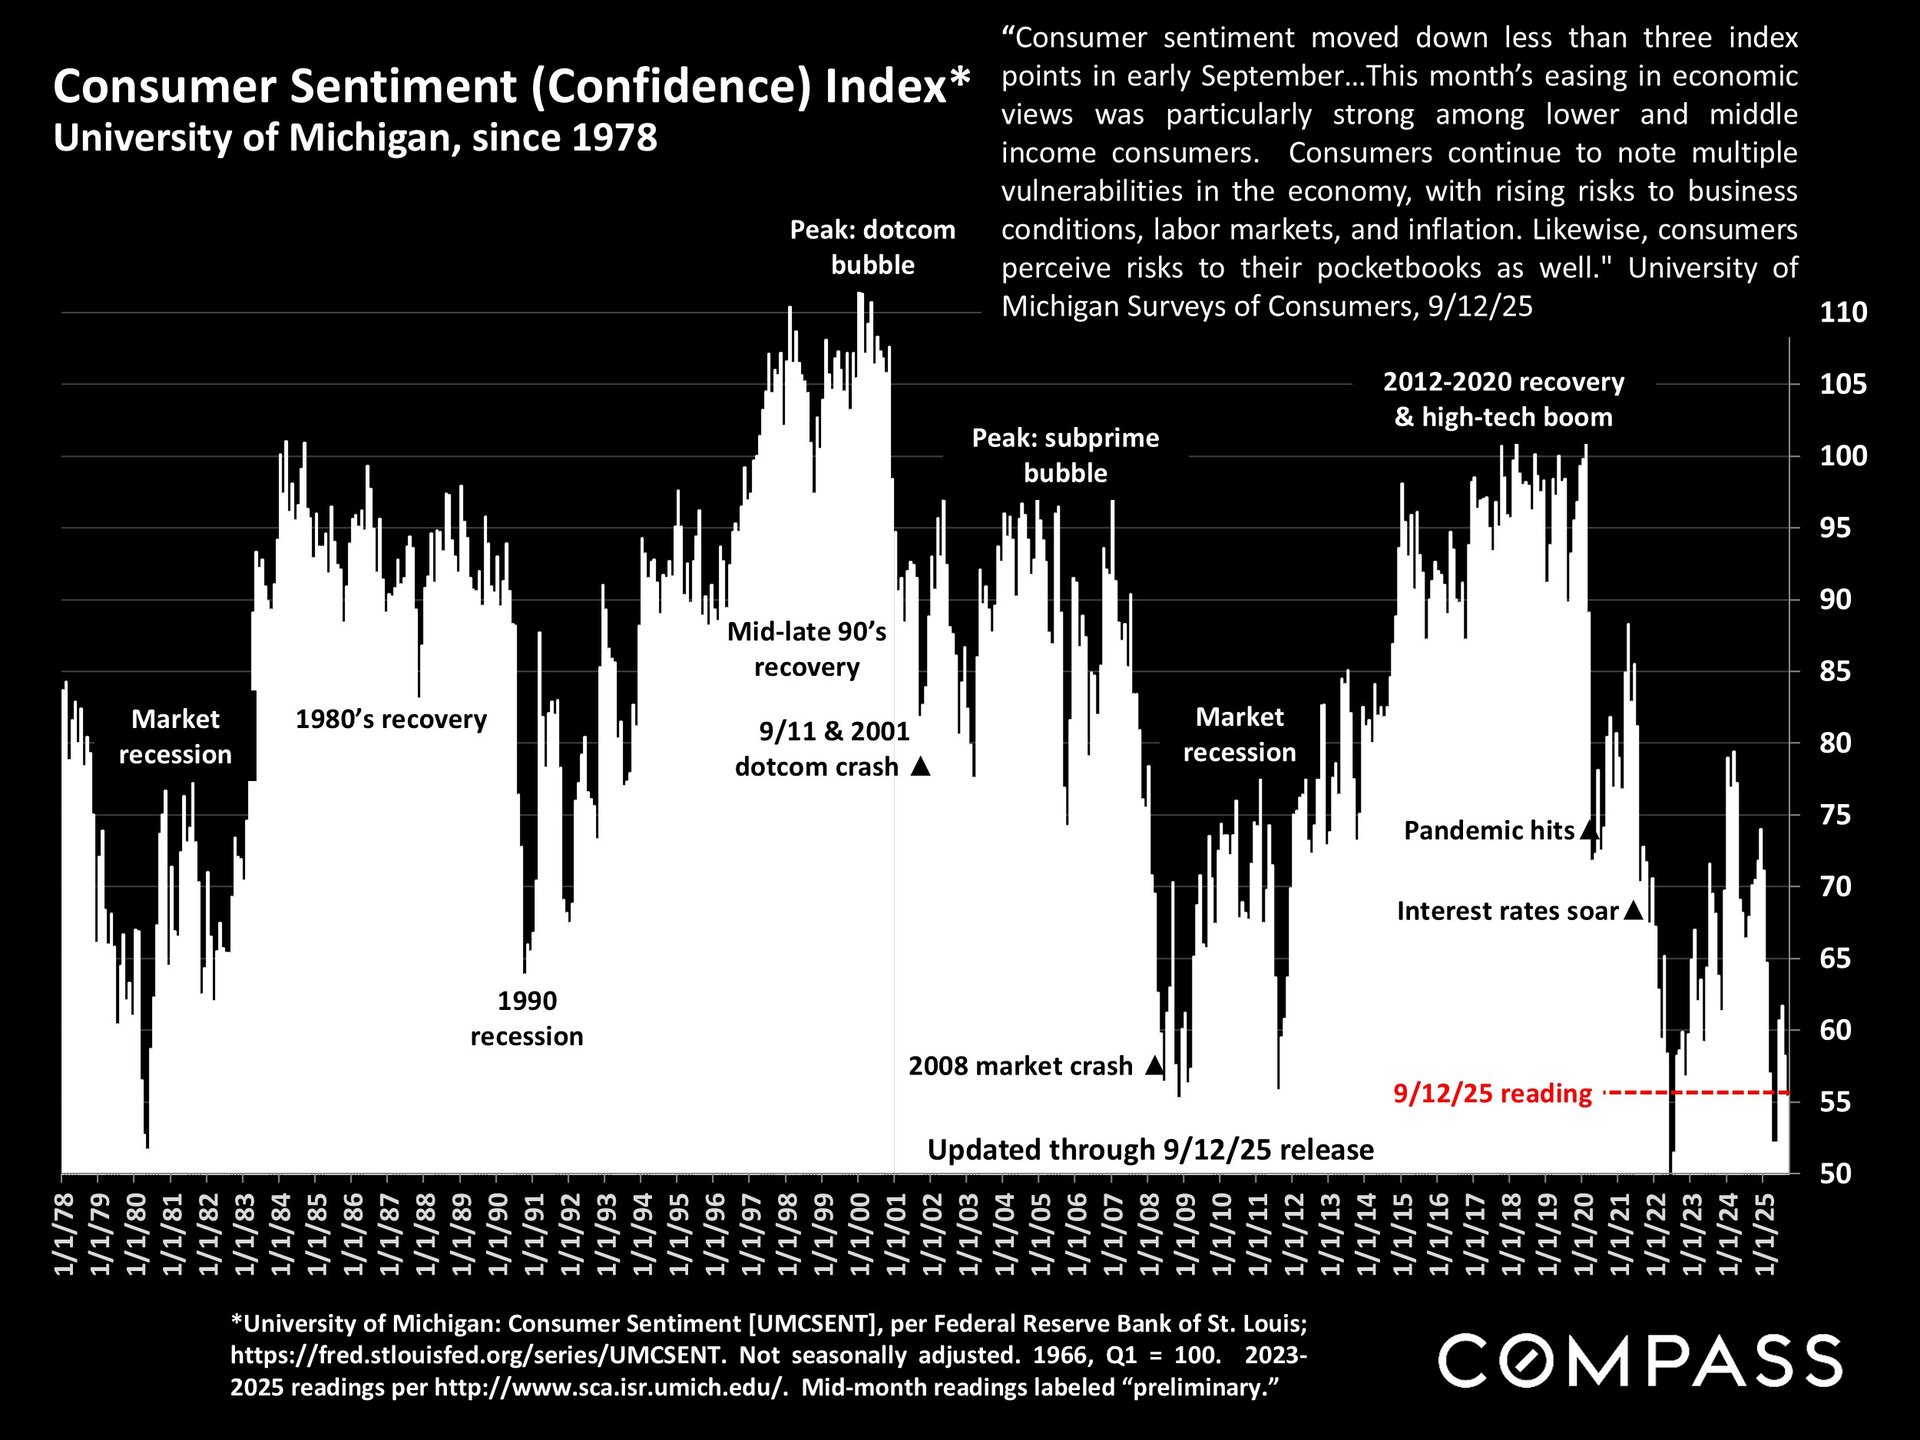
Consumer Sentiment (University of Michigan) is moving on quite a different track than stock markets, and has fallen for the last 2 months to an extremely low reading by historical norms: "Consumer sentiment moved down less than three index points in early September. This month’s easing in economic views was particularly strong among lower and middle income consumers...Consumers continue to note multiple vulnerabilities in the economy, with rising risks to business conditions, labor markets, and inflation. Likewise, consumers perceive risks to their pocketbooks as well...Year-ahead inflation expectations held steady at 4.8%." 9/12/25
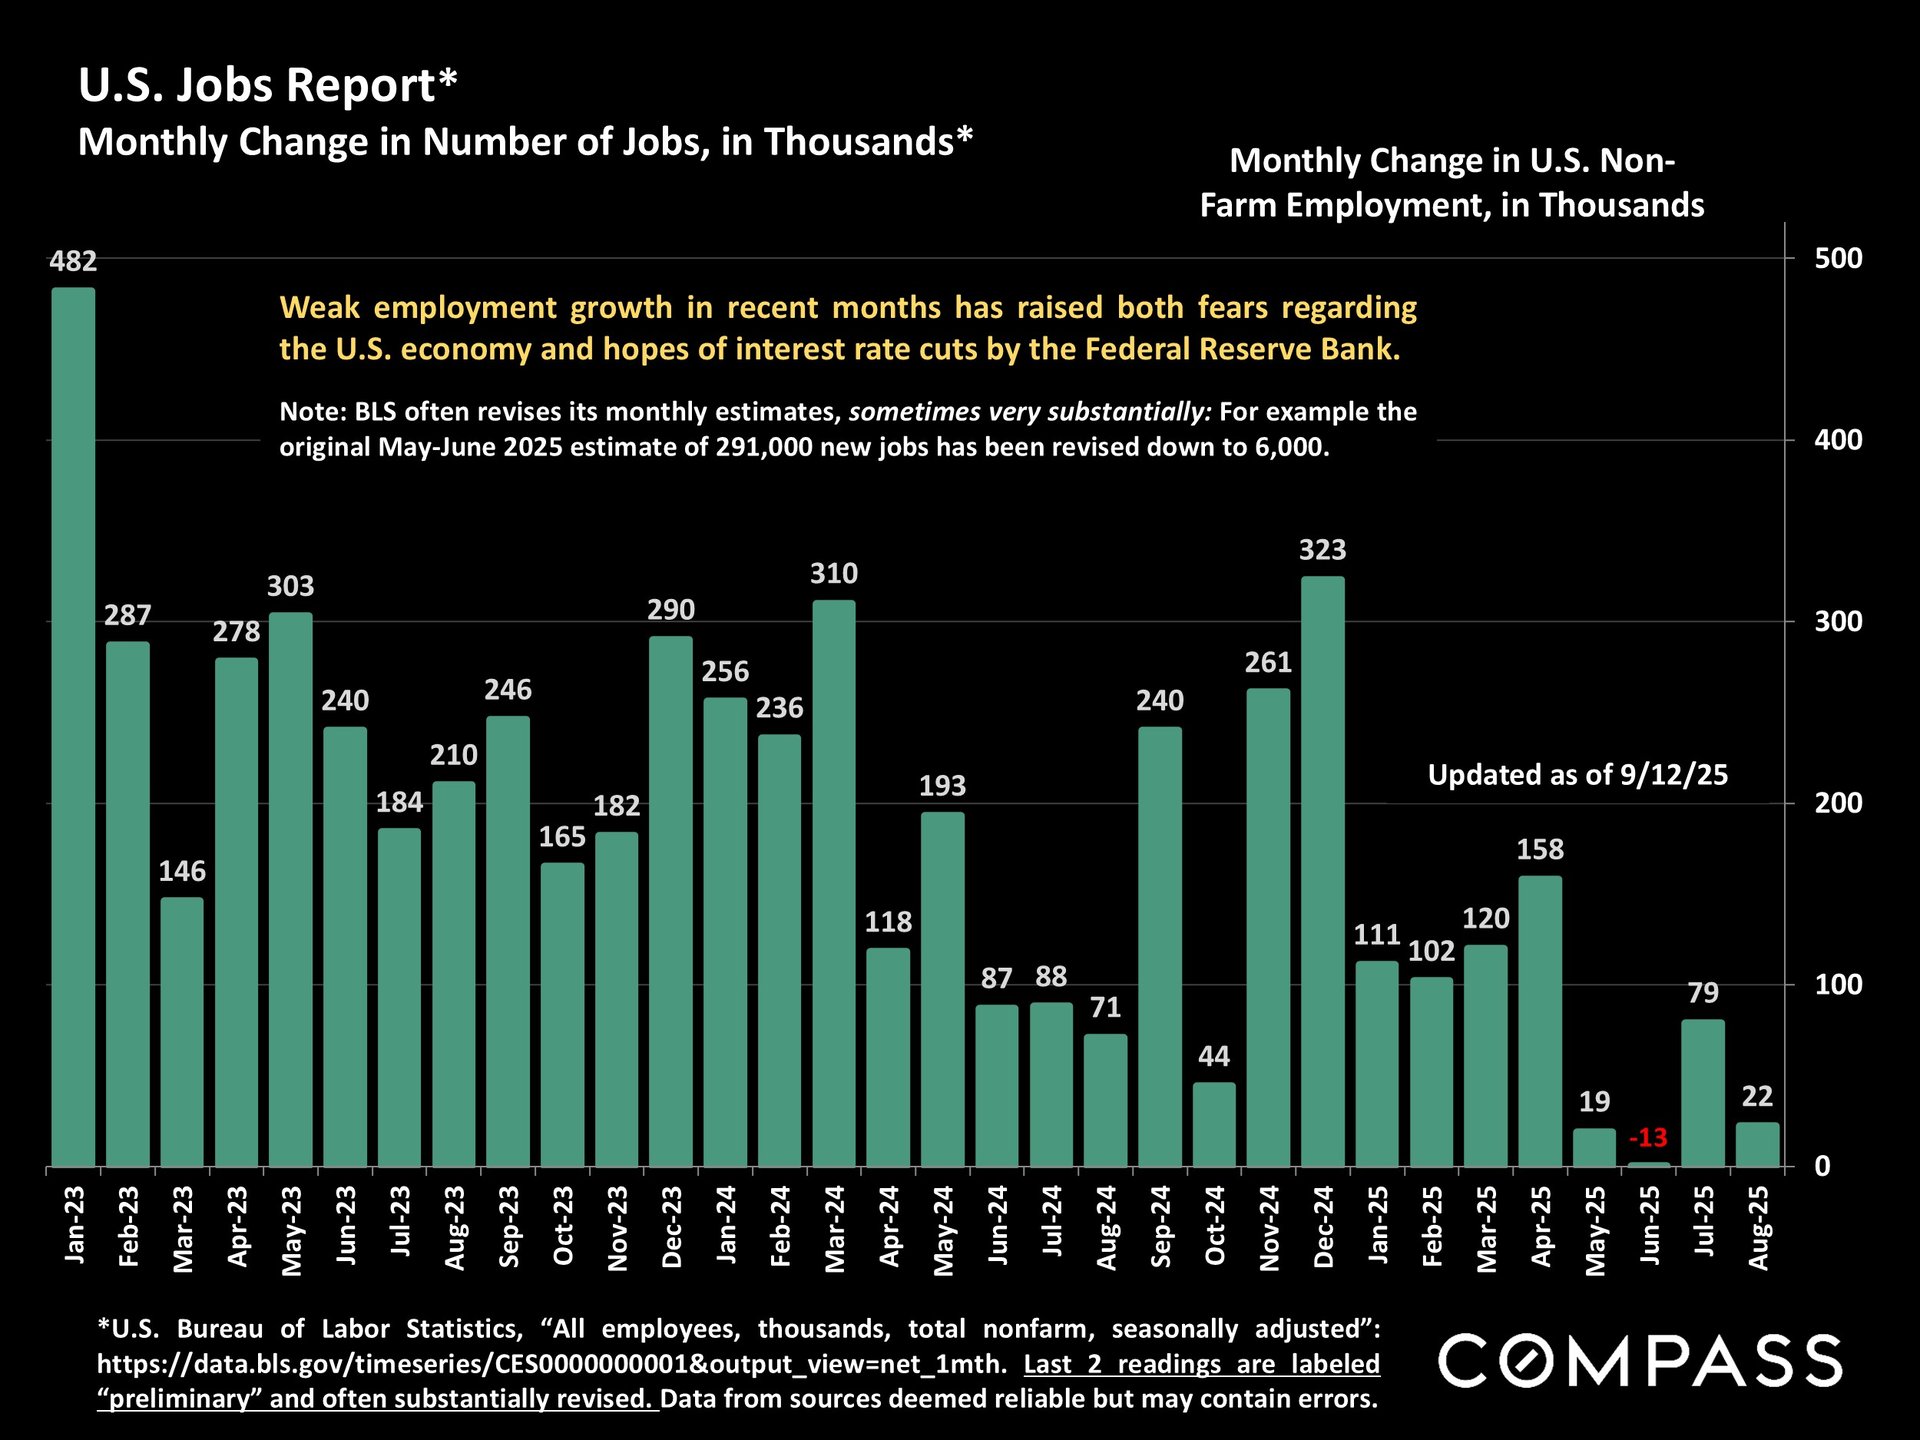
Recent employment reports - that have seen huge revisions in earlier estimates - have generally been deemed dismal, but investors like them, believing they will lead the Fed to reduce rates later this month, and then again, perhaps multiple times, later this year. But much depends on future inflation reports.
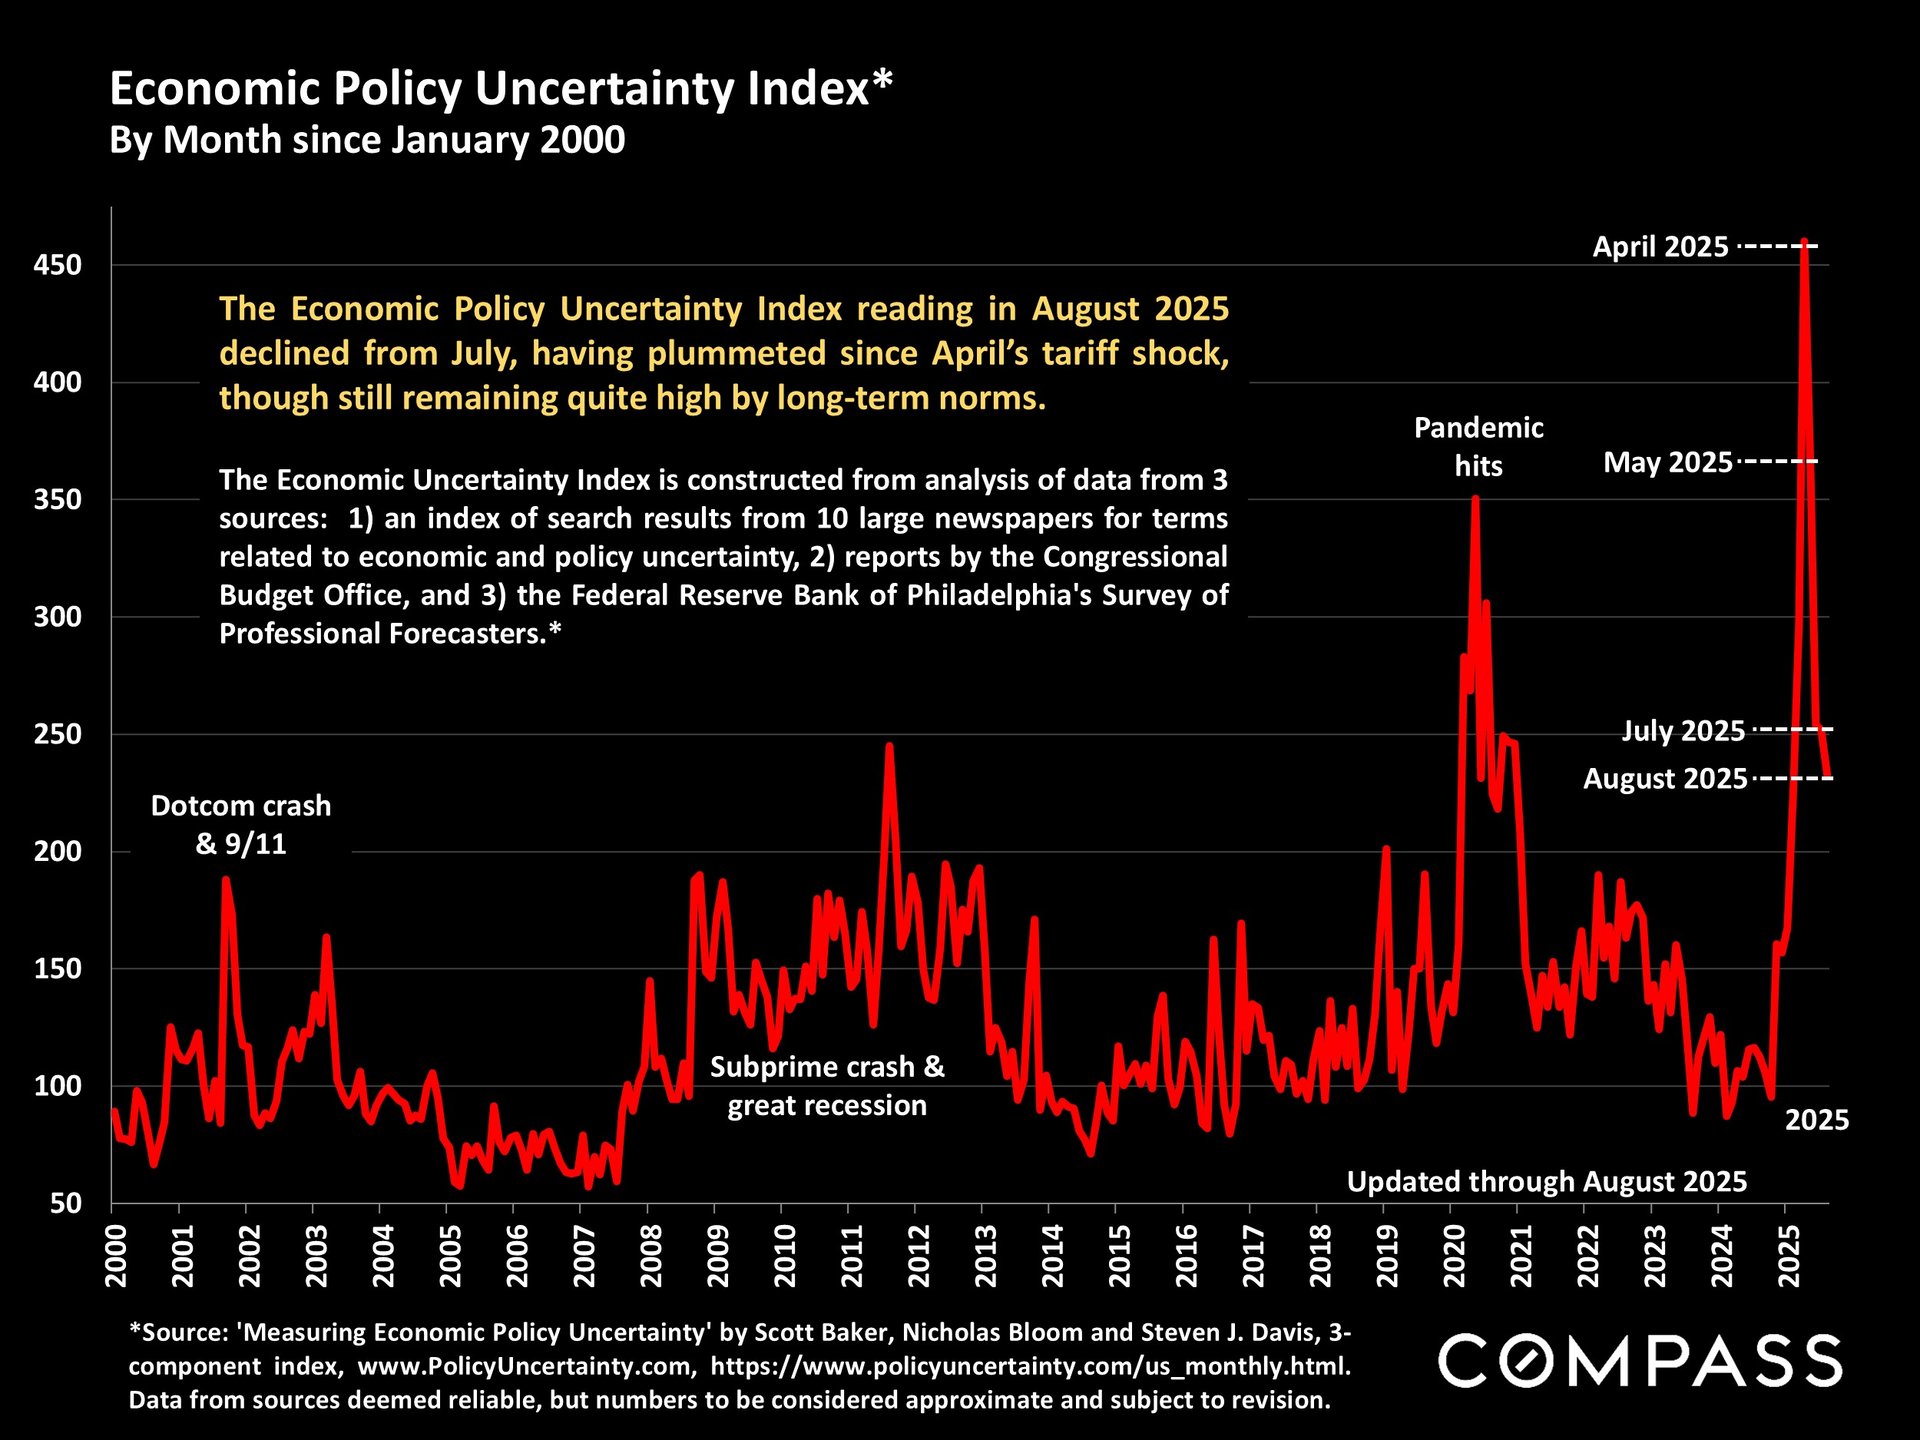
Economic Policy Uncertainty Index: The reading continues to decline, but remains very high by long-term norms.
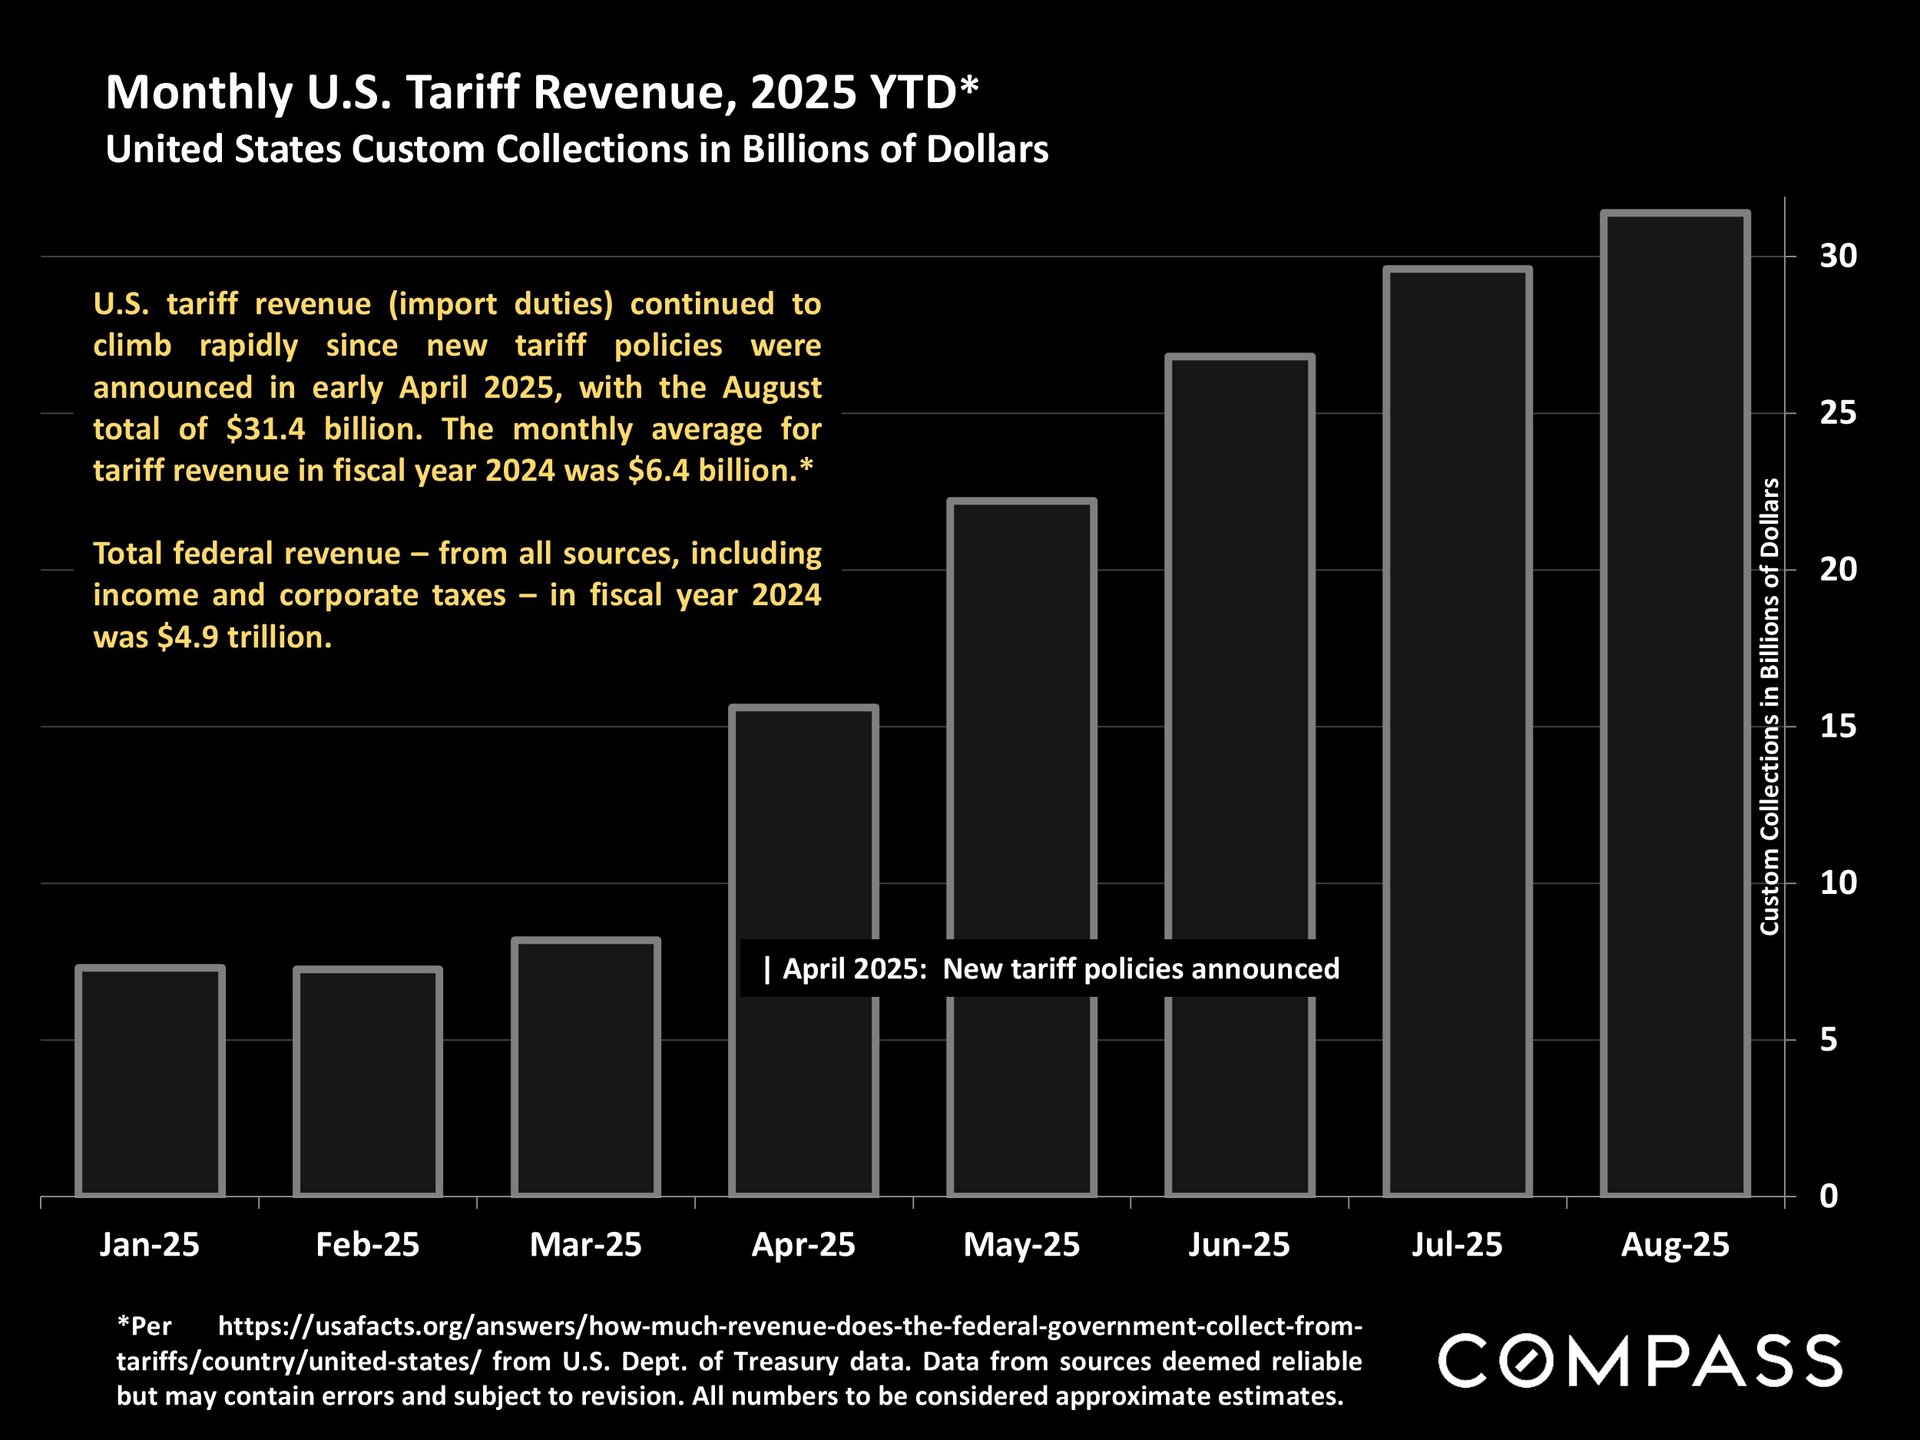
Monthly U.S. tariff revenue is now running almost 5 times the average monthly rate last year.
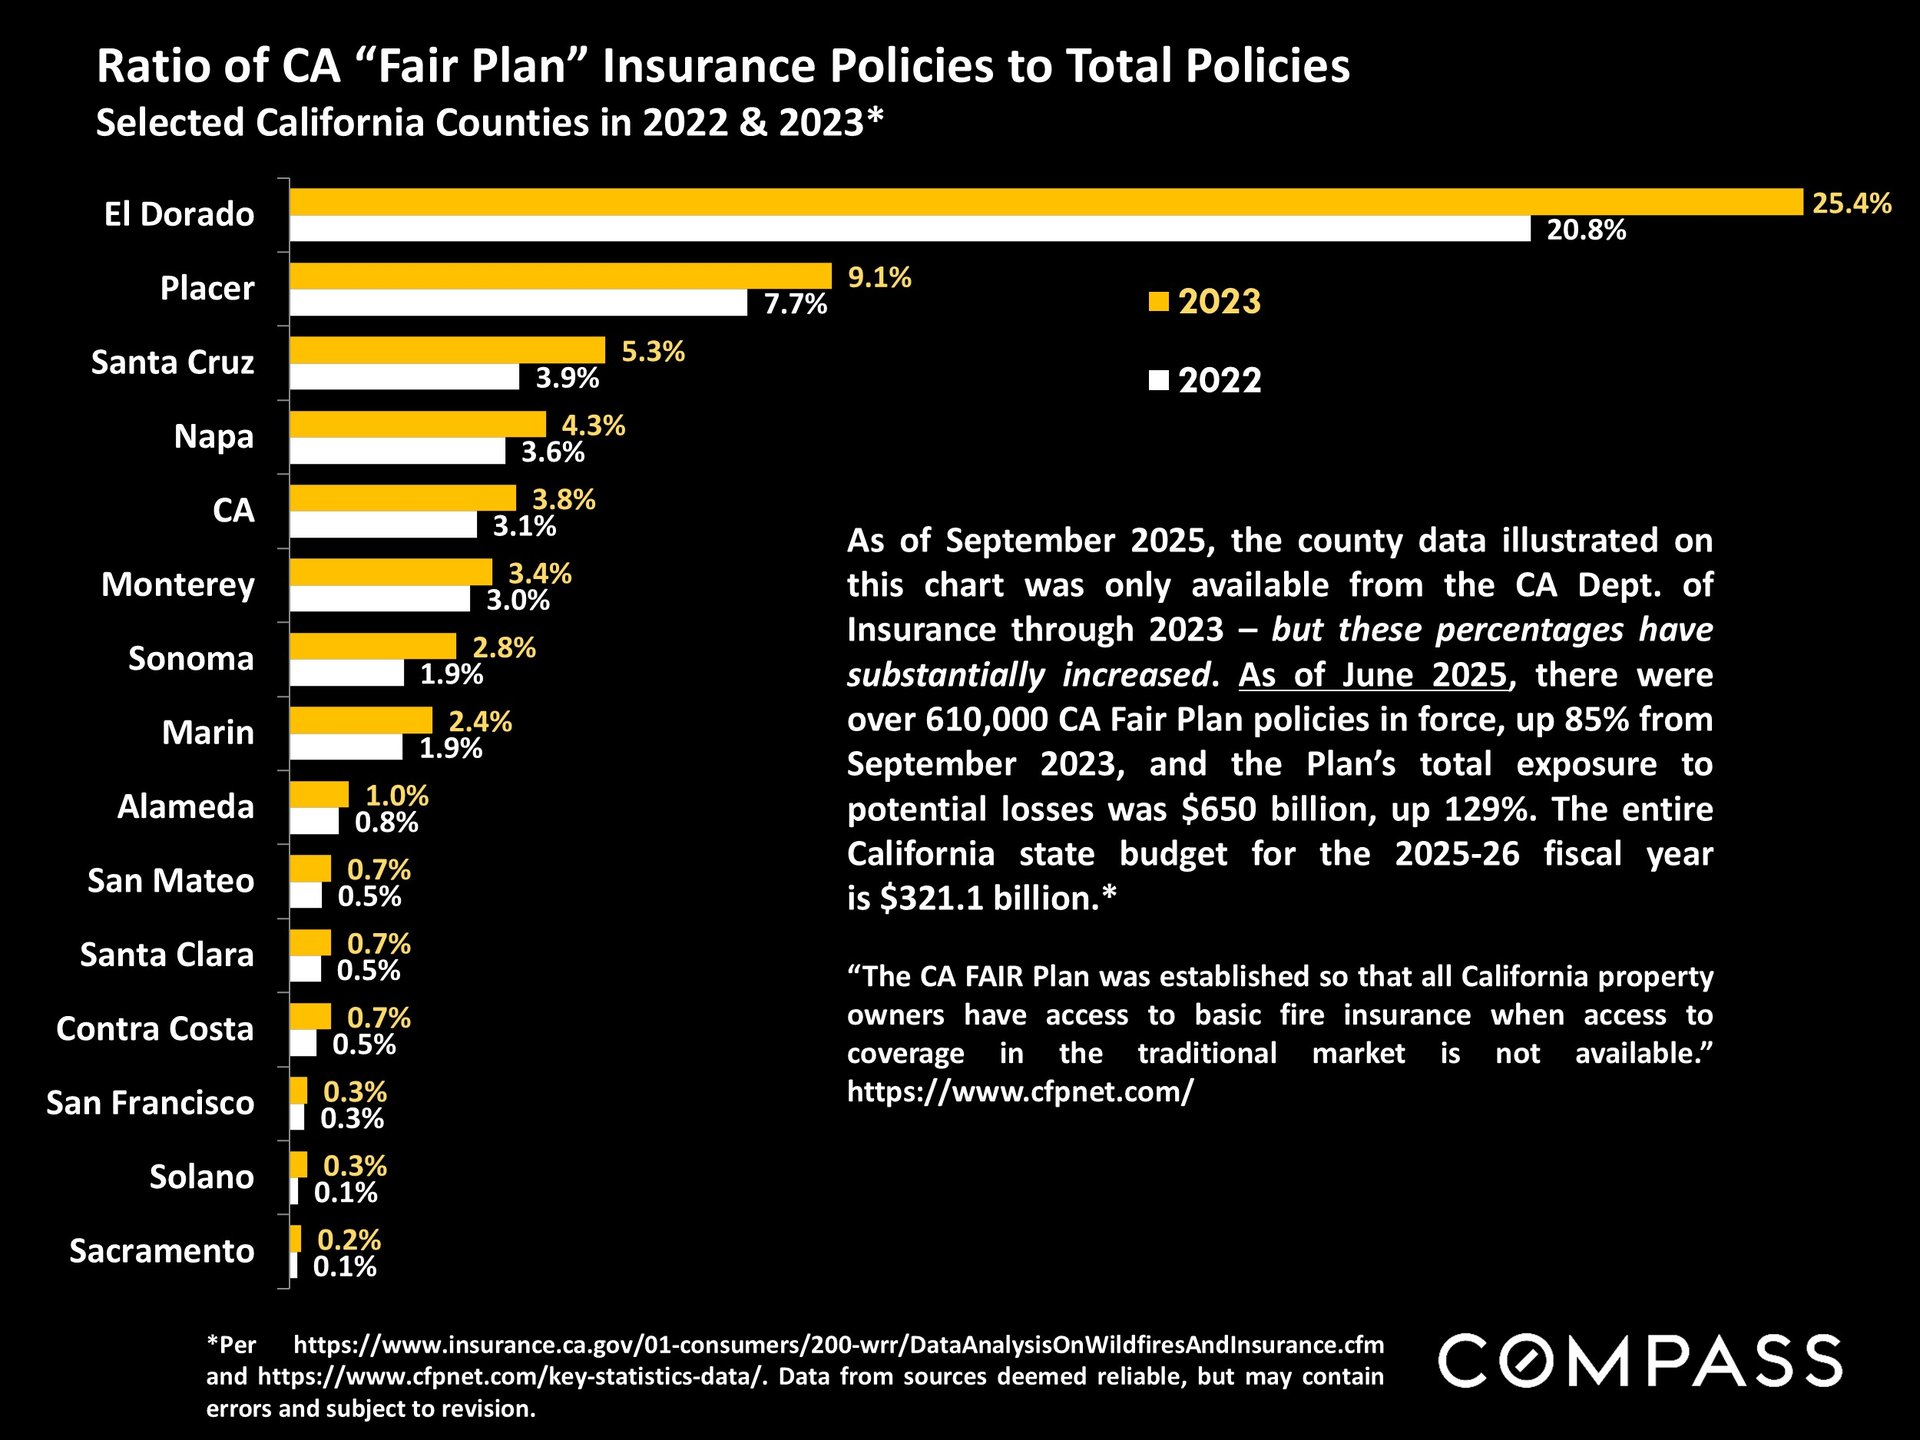
CA Fair Plan: The statistics in the chart below regarding the percentage of county policies now under the Fair Plan compare 2023 to 2022, are the most recent available, though the paragraph of text updates the state data through June 2025.
Realtor.com just published a national report on climate risks and insurance costs: https://www.realtor.com/research/climate-risk-2025/
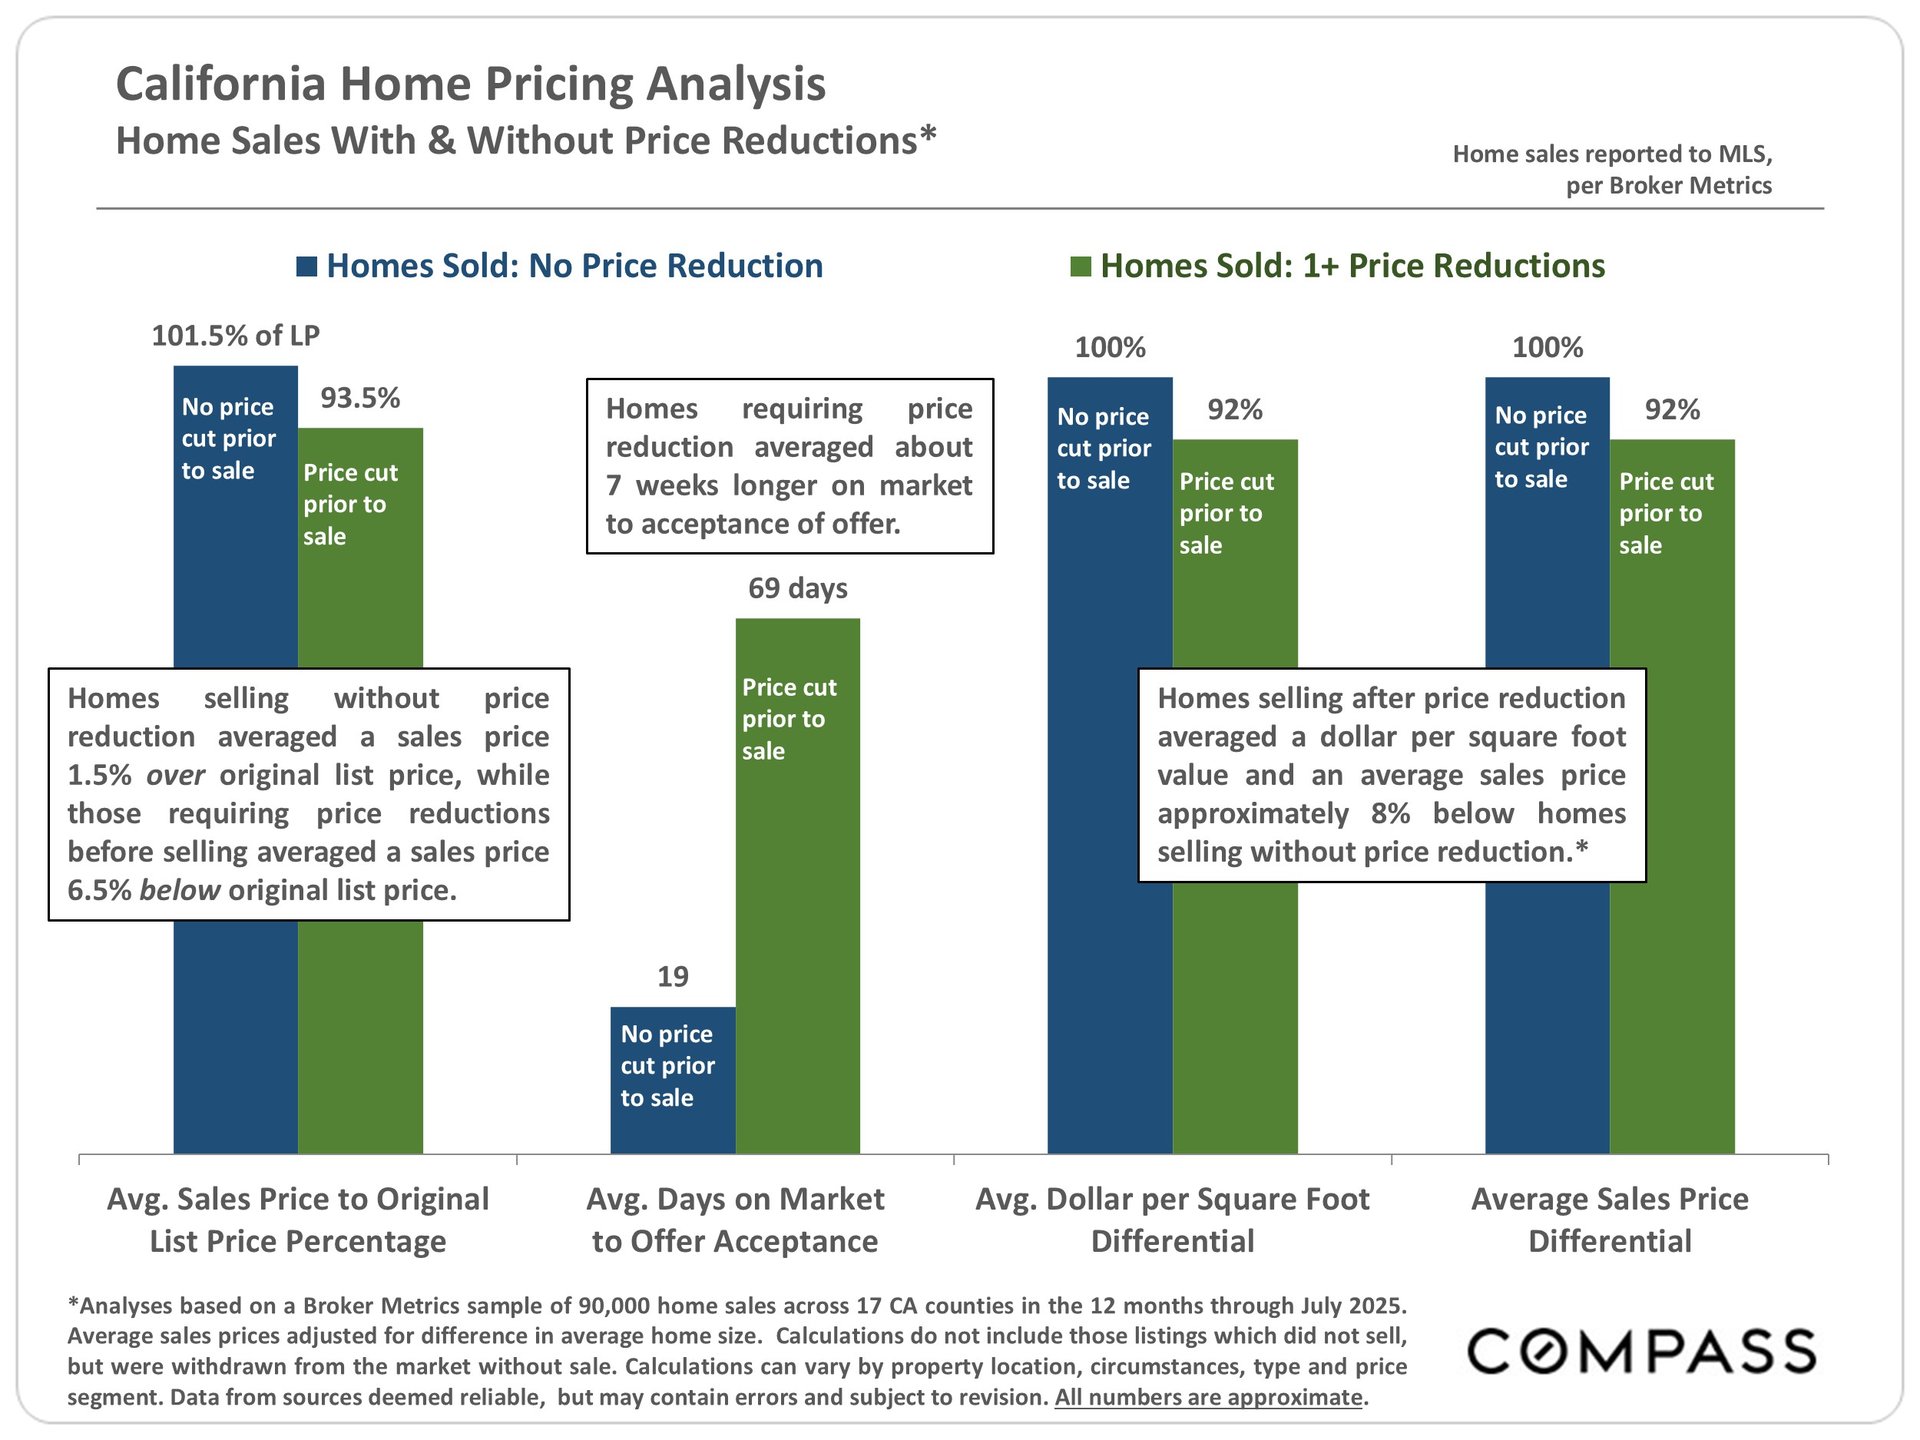
The effects of overpricing, comparing price-reduced and non-price-reduced sales across 17 CA Counties: Sample of 90,000 sales in the past 12 months. Note that the specific variances between SP-OP, DOM and sales price are not the point - those all vary constantly between sales of properties of different location, circumstances, type and price segment. (For example, luxury home sales typically see significantly larger variances.) The point is that the differences are, on average, always substantial, with significant effects on seller proceeds. Different regional versions of the full report can be found here.