A regional housing market report can provide perspective, but the details become more useful when we look closer to home.
September’s Compass city snapshots show three distinct patterns: Berkeley recorded higher prices and more completed sales, Oakland saw a modest price increase with relatively steady sales volume, and Alameda posted higher prices alongside fewer transactions.
For buyers and homeowners, these differences offer a useful starting point for understanding the local market—and why one regional headline rarely captures the full picture.
September’s Local Market Snapshot
Single-Family Home Indicator | Berkeley | Oakland | Alameda |
|---|---|---|---|
Median sale price | $1,800,000 | $950,000 | $1,425,000 |
Price change year over year | +9.1% | +3.6% | +4.8% |
Homes sold | 52 | 177 | 24 |
Sales change year over year | +37% | −1.7% | −33% |
Days on market | 14 | 14 | 13 |
Figures reflect the accompanying Compass September 2026 city market graphics. Prices are rounded as displayed.
Berkeley: Higher Prices Alongside More Sales
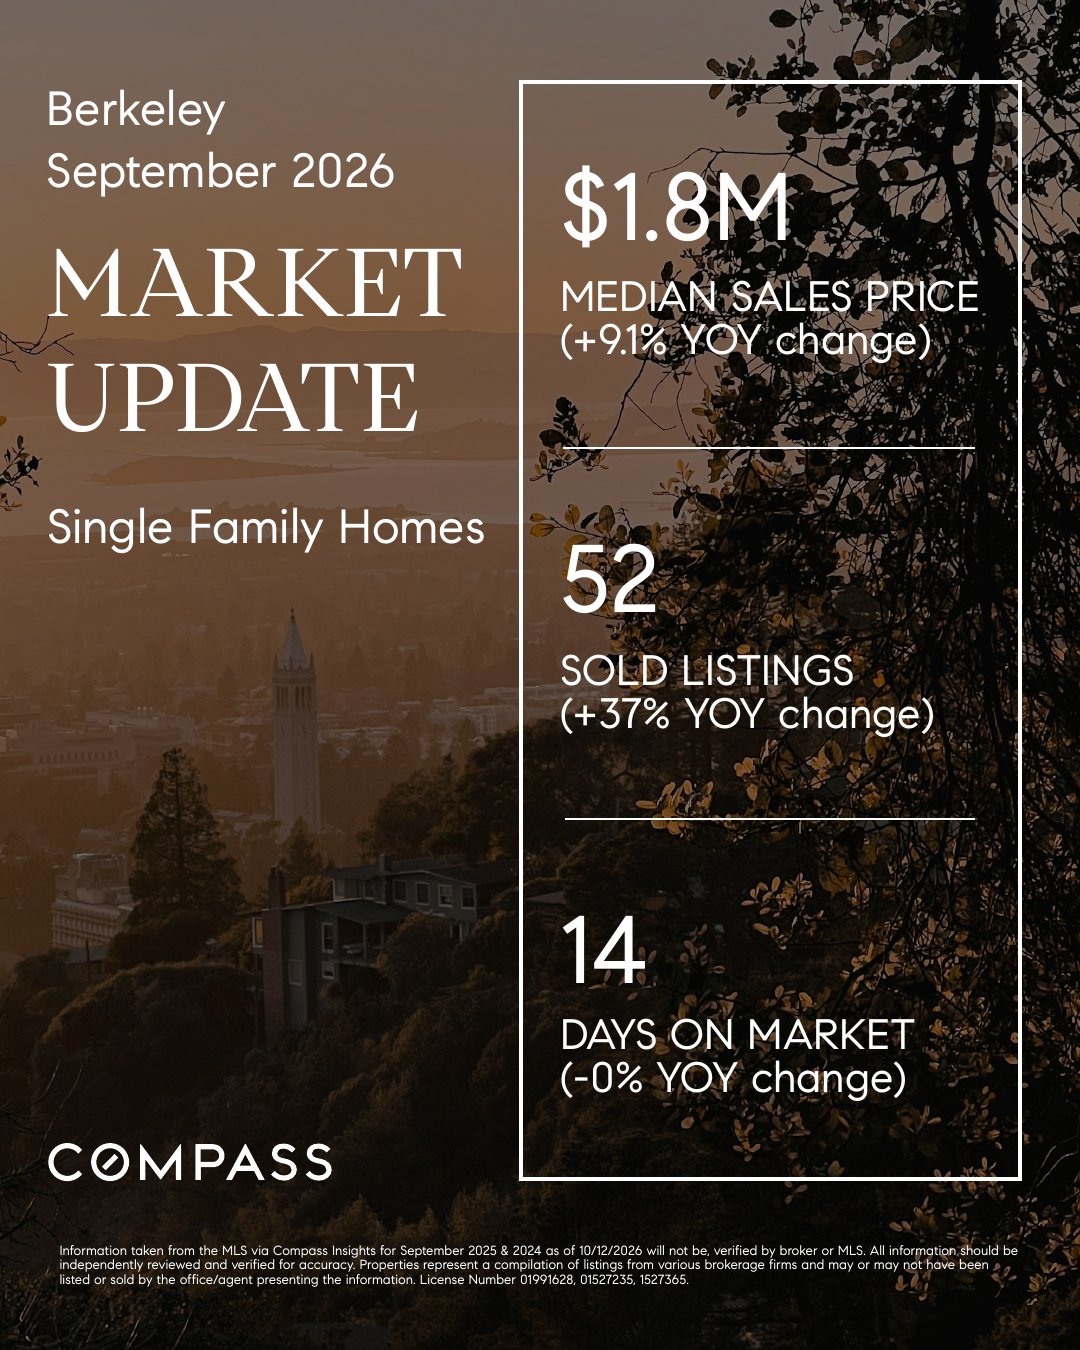
Berkeley’s median single-family sale price reached approximately $1.8 million, up 9.1% year over year. Completed sales increased 37% to 52 homes, while days on market held at 14.
Among these three city snapshots, Berkeley recorded the largest year-over-year increases in both median price and sales volume.
That combination makes Berkeley worth watching as fall progresses. However, a higher monthly median does not mean every Berkeley home appreciated by the same percentage. The size, condition, location, and mix of properties sold can influence the result.
For a homeowner considering selling, the next step is to examine comparable properties nearby. Which homes attracted attention? How were they prepared? Where did their final prices land relative to similar sales?
Those details help turn a citywide trend into a useful pricing strategy.
Oakland: A Broader Market With Relatively Steady Sales
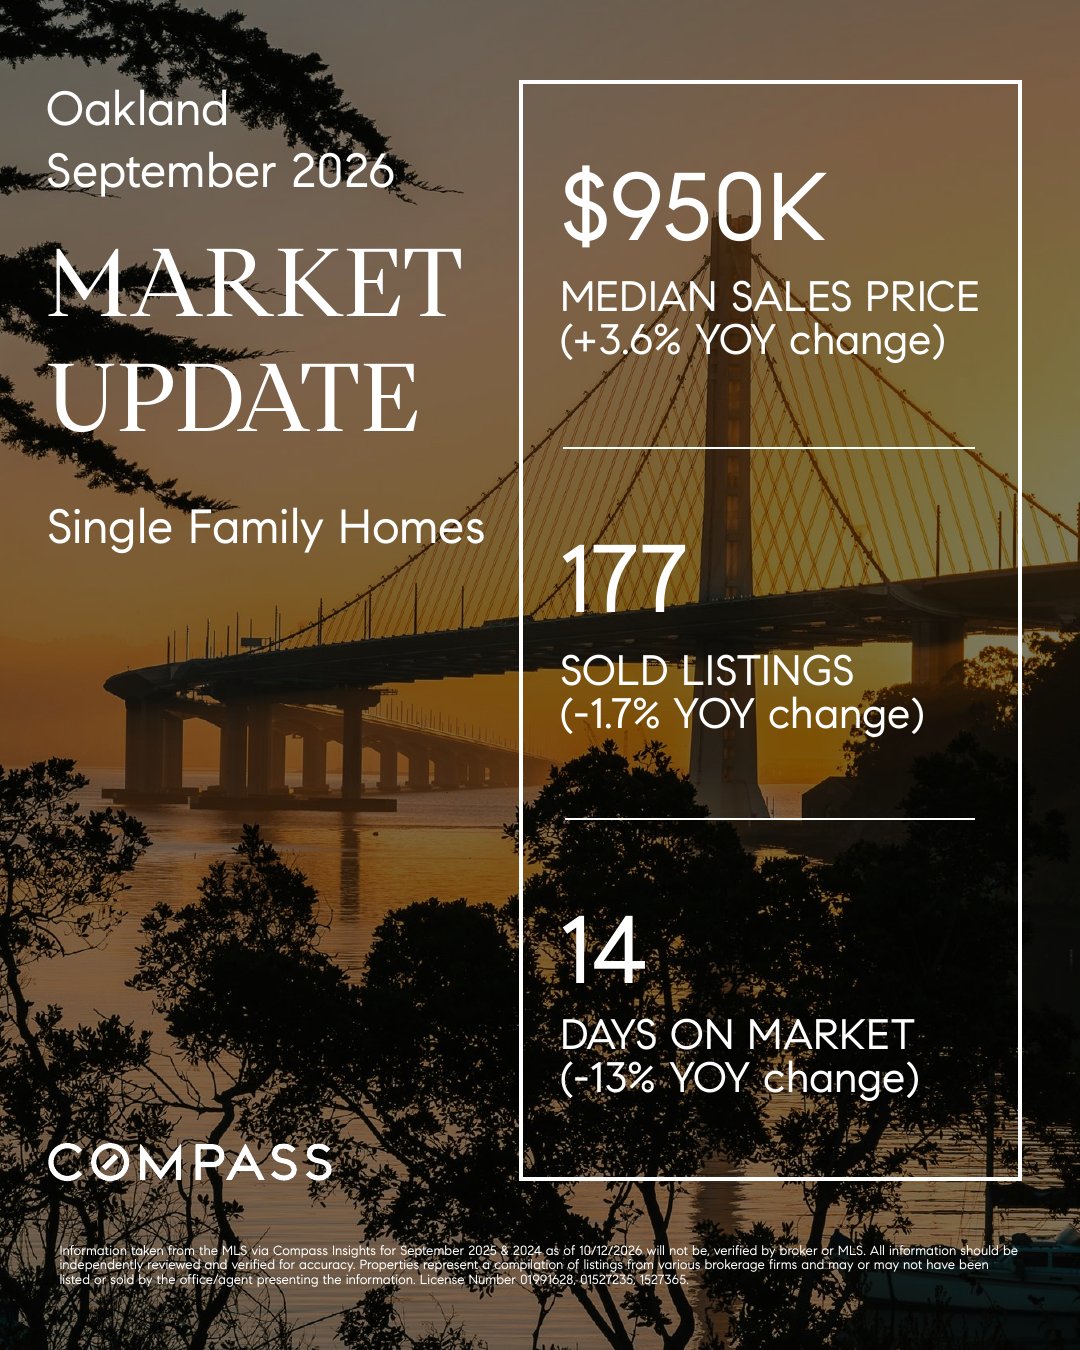
Oakland recorded 177 single-family home sales in September, down 1.7% from a year earlier. The median sale price rose 3.6% to approximately $950,000, with 14 days on market.
Oakland had substantially more completed transactions than either Berkeley or Alameda. Its larger sales volume provides a broader view of activity, but the citywide median still brings together properties across many neighborhoods and price ranges.
For buyers, that makes a focused search especially valuable. Comparing homes with similar locations, layouts, condition, and features offers more practical guidance than treating the citywide median as a target price.
For sellers, the same principle applies: the most relevant competition is the group of properties a likely buyer would consider alongside yours.
Alameda: Fewer Transactions, a Higher Median
Neighboring Alameda adds another perspective to the local comparison.
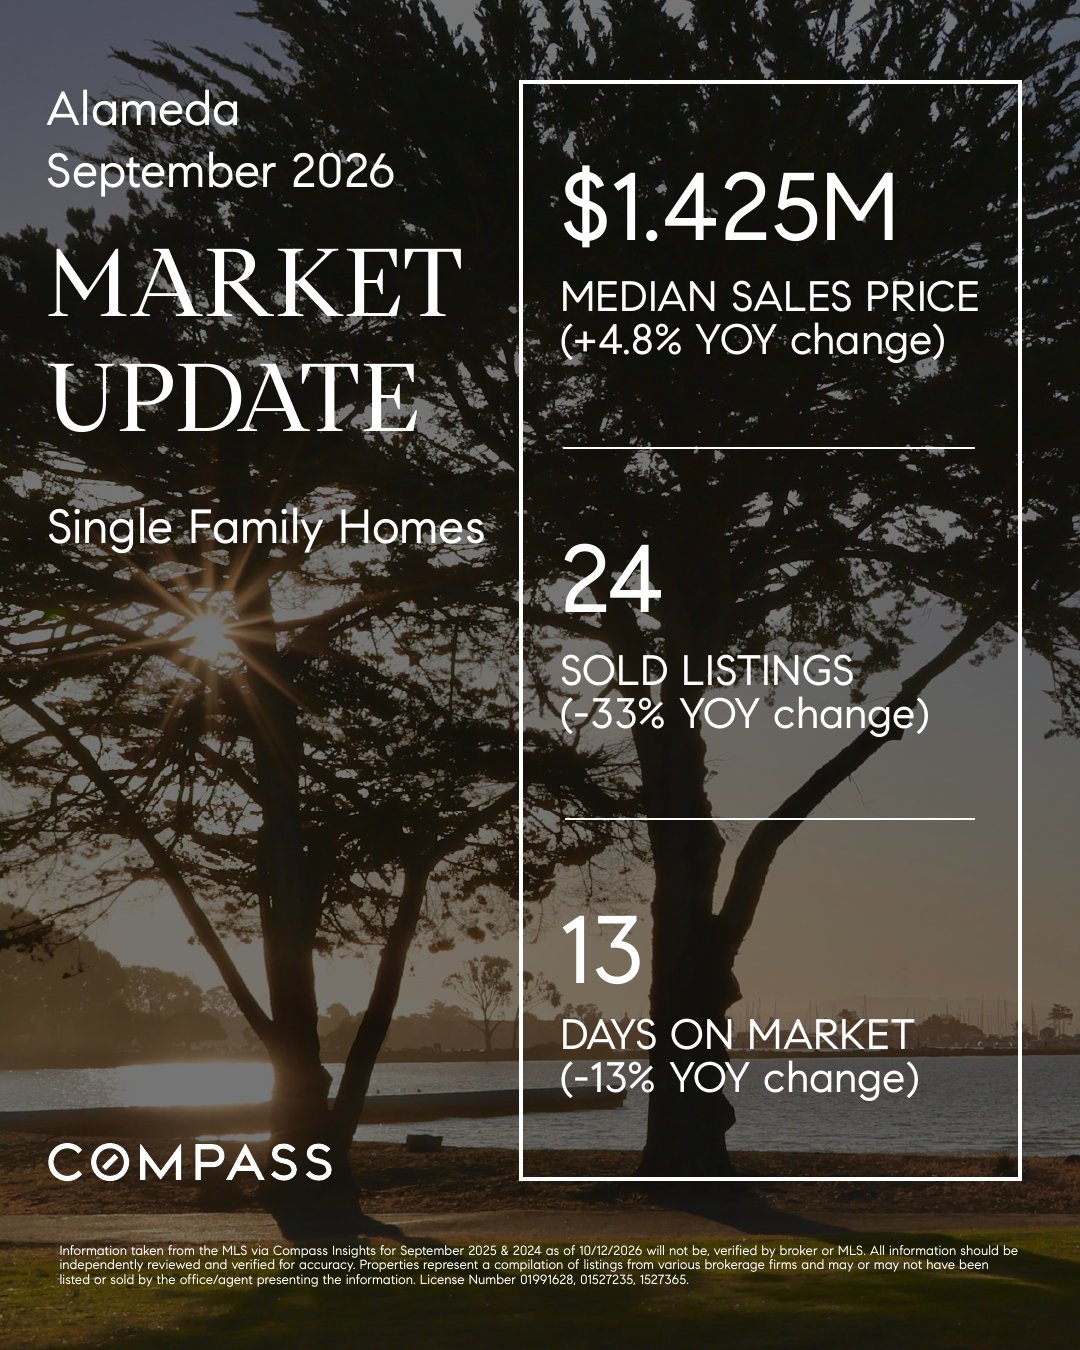
The city recorded 24 single-family home sales, down 33% year over year, while its median sale price increased 4.8% to approximately $1.425 million. Days on market stood at 13, down 13%.
These figures show why sales volume, pricing, and market pace deserve separate attention. Fewer completed transactions can occur alongside a higher median price and shorter marketing times.
With a smaller monthly sales pool, the characteristics of individual properties can also have a greater effect on the median. One month’s change is best considered alongside a longer period of sales and current competing listings.
Similar Market Pace, Different Price Points
One detail stands out across all three graphics: days on market ranged from 13 to 14, despite substantial differences in median prices and transaction counts.
That makes preparation important for buyers. Financing, priorities, and a clear understanding of comparable sales are easier to establish before finding a home that feels right.
For sellers, a short citywide marketing period is a benchmark rather than a promise. The response to an individual listing will still depend on its price, presentation, condition, and alternatives available to buyers.
What to Watch Through Fall
The next few months will help show whether September’s patterns continue.
In Berkeley, we’ll be watching whether the increase in completed sales carries forward. In Oakland, neighborhood-level activity will remain essential to understanding the broader numbers. In Alameda, additional months of data will help put the smaller September sales count into context.
Across these communities, the most useful questions remain property-specific: What is available now? What has recently sold? How does a particular home compare?
A Closer Look at Your Neighborhood
Whether you’re considering selling or planning your next purchase, understanding your local market starts with the homes most relevant to your decision.
Thinking about selling? We’d love to help you understand how your home compares with recent neighborhood sales and what thoughtful preparation could look like for your next chapter.
Nasi White + Soulmaz Panahi
Compass | Berkeley & East Bay Real Estate
Nasi White | DRE #01889128
Soulmaz Panahi | DRE #02036944
Source: Accompanying Compass city market graphics labeled September 2026, single-family homes. Monthly median prices reflect the properties sold during the period and are not a measure of appreciation for an individual home. Figures may be revised.