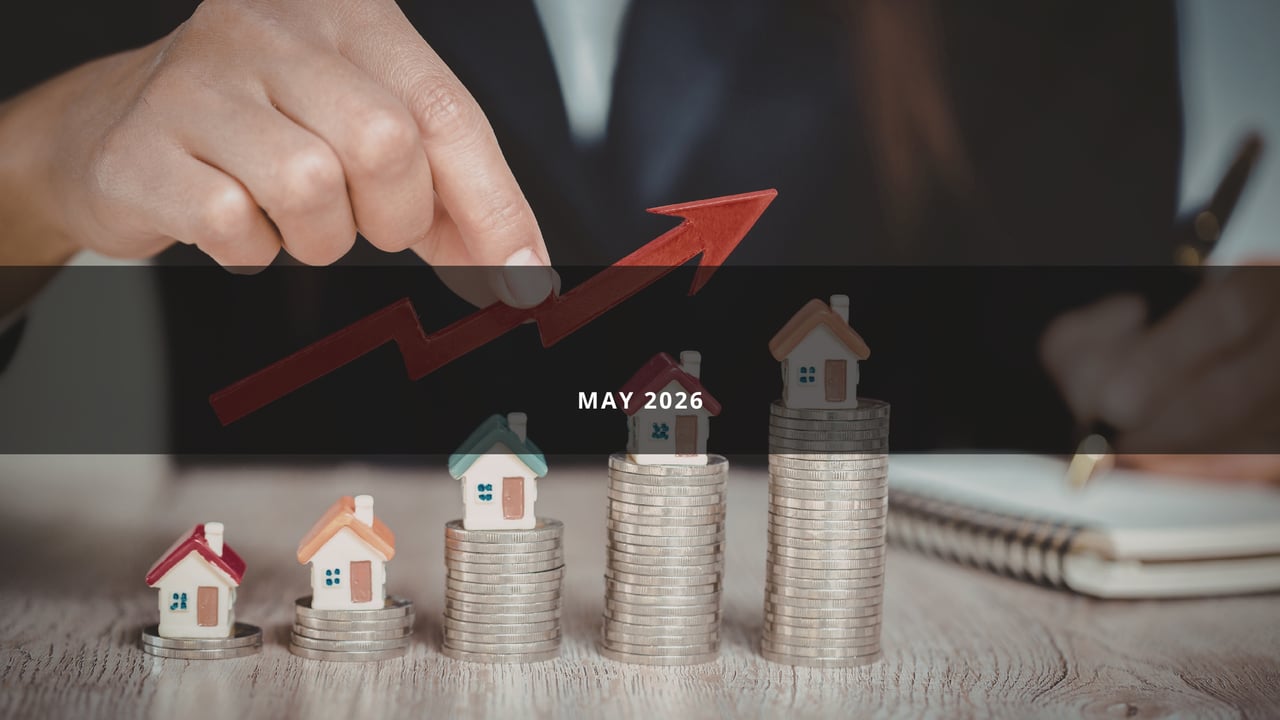
Miniature houses on rising stacks of coins beneath an upward arrow, labeled May 2026.

Compass National Real Estate Insights

Positive Momentum Meets Inflation Headwinds

As we roll into peak homebuying season at the end of May, the housing market has (finally) turned in some positive momentum and the economy is showing some positive reversals of recent trends. Equities markets have surged to new highs. The long-sluggish labor market has shown some green shoots of improvement. Unemployment and initial jobless claims remain relatively low and, in the latest data, hiring and job creation seem to have improved.

In this year’s housing cycle, we’re focused more on the hiring rate in the economy rather than the usual unemployment numbers. Since relocation-for-work is one of the big drivers of housing demand, a very low hiring rate in 2026 continues to be the biggest drag on housing demand, after affordability. If companies are not hiring quickly, there are fewer people moving for work.

In March, the hiring rate data was as low now as the bottom or the pandemic shutdown. But in April the data rebounded to 3.5%. Continued growth in hiring will be important if home sales are going to grow meaningfully for the rest of 2026.

The negative news in this spring’s economy is around inflation. Energy costs, tariffs, and government spending are all contributing to rising prices. The war-driven uncertainty has driven energy prices sharply higher and the inflation impacts are only just hitting the economy now.

Unfortunately, higher inflation and stronger employment is not the economic setup that tends to push interest rates lower. As of mid-May, mortgage rates responding to inflation news are at their highest levels of the year. Don’t look to the Fed for interest rate relief until the inflation trend turns.

An interesting question is whether a booming stock market is enough to move the needle on the housing market. We can see the AI boom directly in San Francisco home prices and rents, but it remains to be seen whether middle America feels a wealth boom from equities or a cash crunch from inflation, and how that impacts home buying activity through the summer.

As mortgage rates gradually declined over the last year, the inventory story has changed too. After growing quickly for several years, the supply of homes on the market is now unchanged from last year and could be heading lower. Shrinking inventory would be a big surprise for most market watchers in 2026.

Because supply has been growing nationally for years, we can now measure the negative price pressures in much of the country. If inventory continues to decline in 2026, that implies price stability in 2027.

I was in Austin recently for a Compass event. That city’s market may be on the cusp of a turnaround, finally. After four relentless years with inventory climbing, the supply of homes on the market in Austin (Dallas too) is now below last year and ticking downward. Anyone in the Austin market knows that there have been home price pressures for several years, is this finally the inflection point? Stay tuned.

Mike Simonsen

Chief Economist | Compass International Holdings

Mortgage-rate infographic showing weekly rates and yearly distributions from 2012 to 2026, with today marked near 6.5%.Pending home sales line chart compares 2026, 2025, and 2022; 2026 reaches 94,000 in May.Chart of S&P daily change from February 2025 to May 2026, rebounding to new highs in April 2026.Chart shows CPI and PCE inflation rising above the 2% target, peaking in 2022, and ending near 3.3%.Bar chart of monthly U.S. job growth, highlighting 2025’s weak gains and employment growth in April.Line chart of U.S. hiring rates from 2002 to 2026, ending at 3.5% in March 2026.U.S. map of pending home sales changes by state, mostly positive, with declines highlighted in orange.Chart of home sales indicators from January to May, with purchase applications, pending sales, and mortgage intent.Chart of U.S. existing home sales from 2000 to 2026, ending at 4.02 million below the 5.2-million normal level.Line chart of monthly home inventory: 2025 and 2017 end above 2024, while 2026 reaches about 1,003,258 in May.Line chart shows 2026 new listings peaking near 96,000 sellers per week, below typical 2010s levels.Line chart comparing monthly U.S. home days on market from 2022 to 2026; 2026 reaches 71.9 days by May.Infographic charts home price trends from January 2024 to January 2026 across 20 U.S. cities and nationally.Line chart of monthly U.S. active listing prices, showing current trends below 2024 and 2025.Chart of year-over-year home price changes from 2017 to 2026, ending at -3% after 2025 supply growth.Line chart comparing 2025 and 2026 mortgage payments; 2026 reaches $2,295 in May.Line chart compares U.S. single-family home asking prices per square foot across 2024, 2025, and 2026.Chart showing outstanding mortgages by interest-rate band from 2013 to 2025, with 21.9% above 6% in 2025 Q4.Chart of HELOC available credit and balances from 2004 to 2026, showing available credit climbing again after 2022.Line chart shows mortgage delinquency at 1.1%, below credit card, auto, and overall loan delinquency.

Work With Nasi and Soulmaz

We understand that Selling or buying a property is undoubtedly one of the most complex financial and emotional decisions anyone can make. A home holds immense value as both an investment and a place to nurture your family and build lasting security.As a dedicated realtor in the Bay Area, we are committed to delivering a personalized approach to every one of our clients. Understanding your unique goals, desires, and timelines is paramount to us, ensuring an exceptional experience tailored precisely to your needs.Equipped with a data-driven mindsets, we provide you with the necessary information to make the most well-informed decisions possible. The East Bay market is highly competitive, demanding an innovative and tech-savvy approach to stay ahead. We eagerly await the opportunity to collaborate with you and assist in achieving your real estate aspirations.

Follow Me on Instagram