
Alameda County’s housing market is heading into fall with an interesting mix of slower sales and continued competition for single-family homes.
August brought the seasonal cooling we typically see toward the end of summer, but that doesn’t mean buyer demand disappeared. In fact, competition for well-positioned single-family homes remained strong, while the condo market showed considerably more breathing room for buyers.
Here’s what the latest numbers tell us about the Alameda County housing market as we move into fall.
Home Prices Remain Relatively Steady
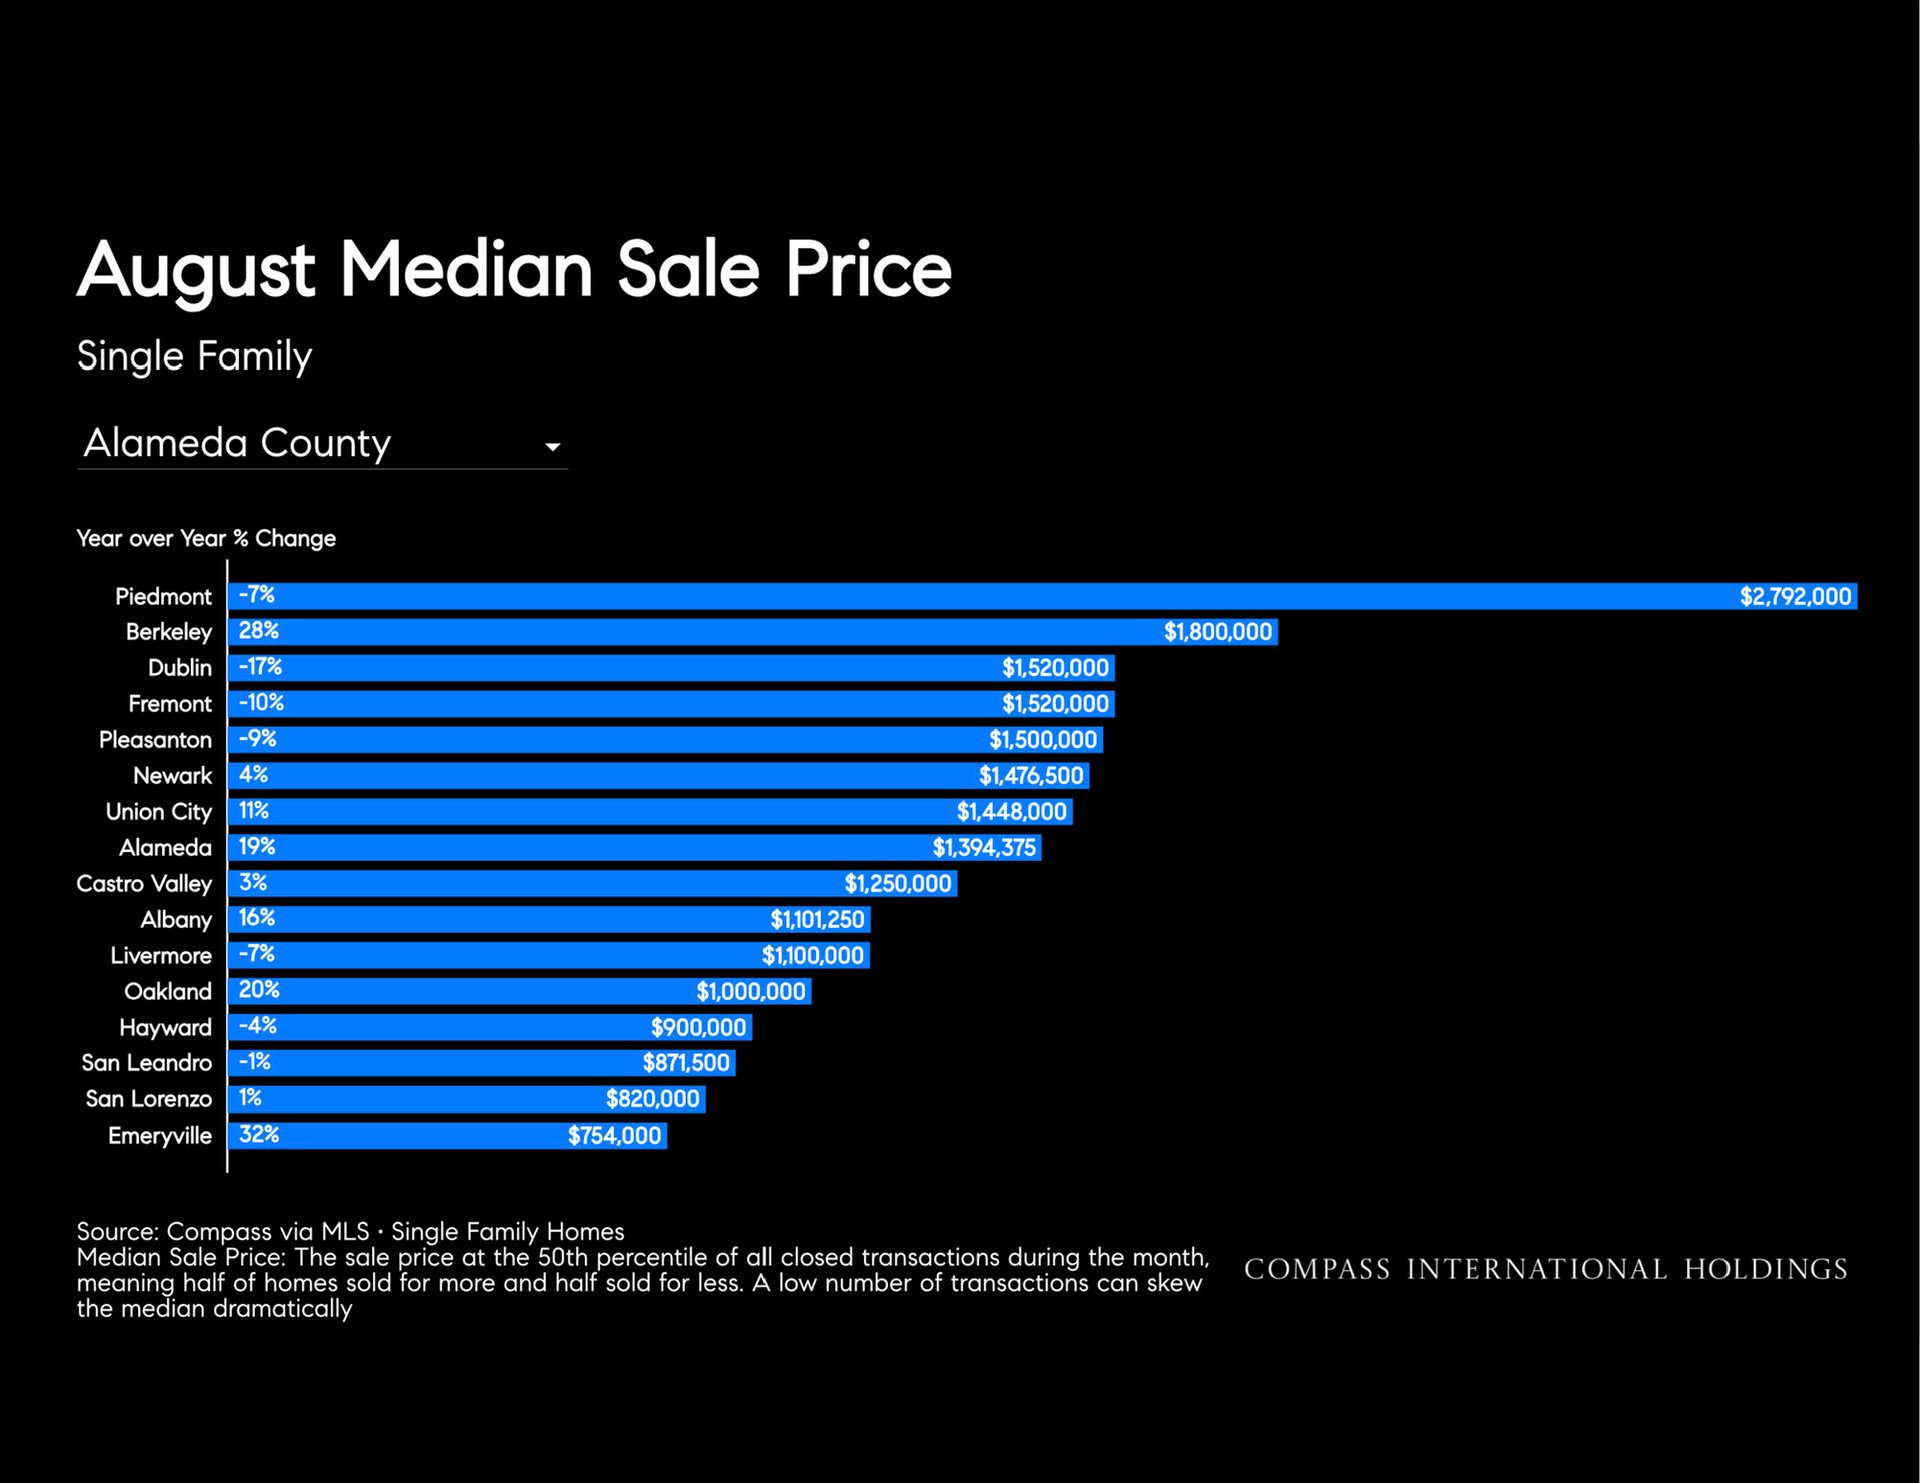
The median sale price for a single-family home in Alameda County was $1.25 million in August, essentially unchanged from a year earlier and down just 1% from July.
While the countywide median remained flat, individual communities told very different stories.
Berkeley, for example, recorded an August median single-family sale price of approximately $1.8 million, while Oakland’s was $1 million. Alameda came in at approximately $1.39 million.
That variation is an important reminder that Alameda County isn't one market. Conditions can change significantly from Berkeley to Oakland, Alameda, Fremont, Piedmont and other East Bay communities.
Fewer Homes Sold, but Competition Remains
Single-family sales slowed in August, with 599 homes closing, down 16% from both the prior year's level and 14% month over month.
But fewer transactions did not translate into weaker competition across the board.
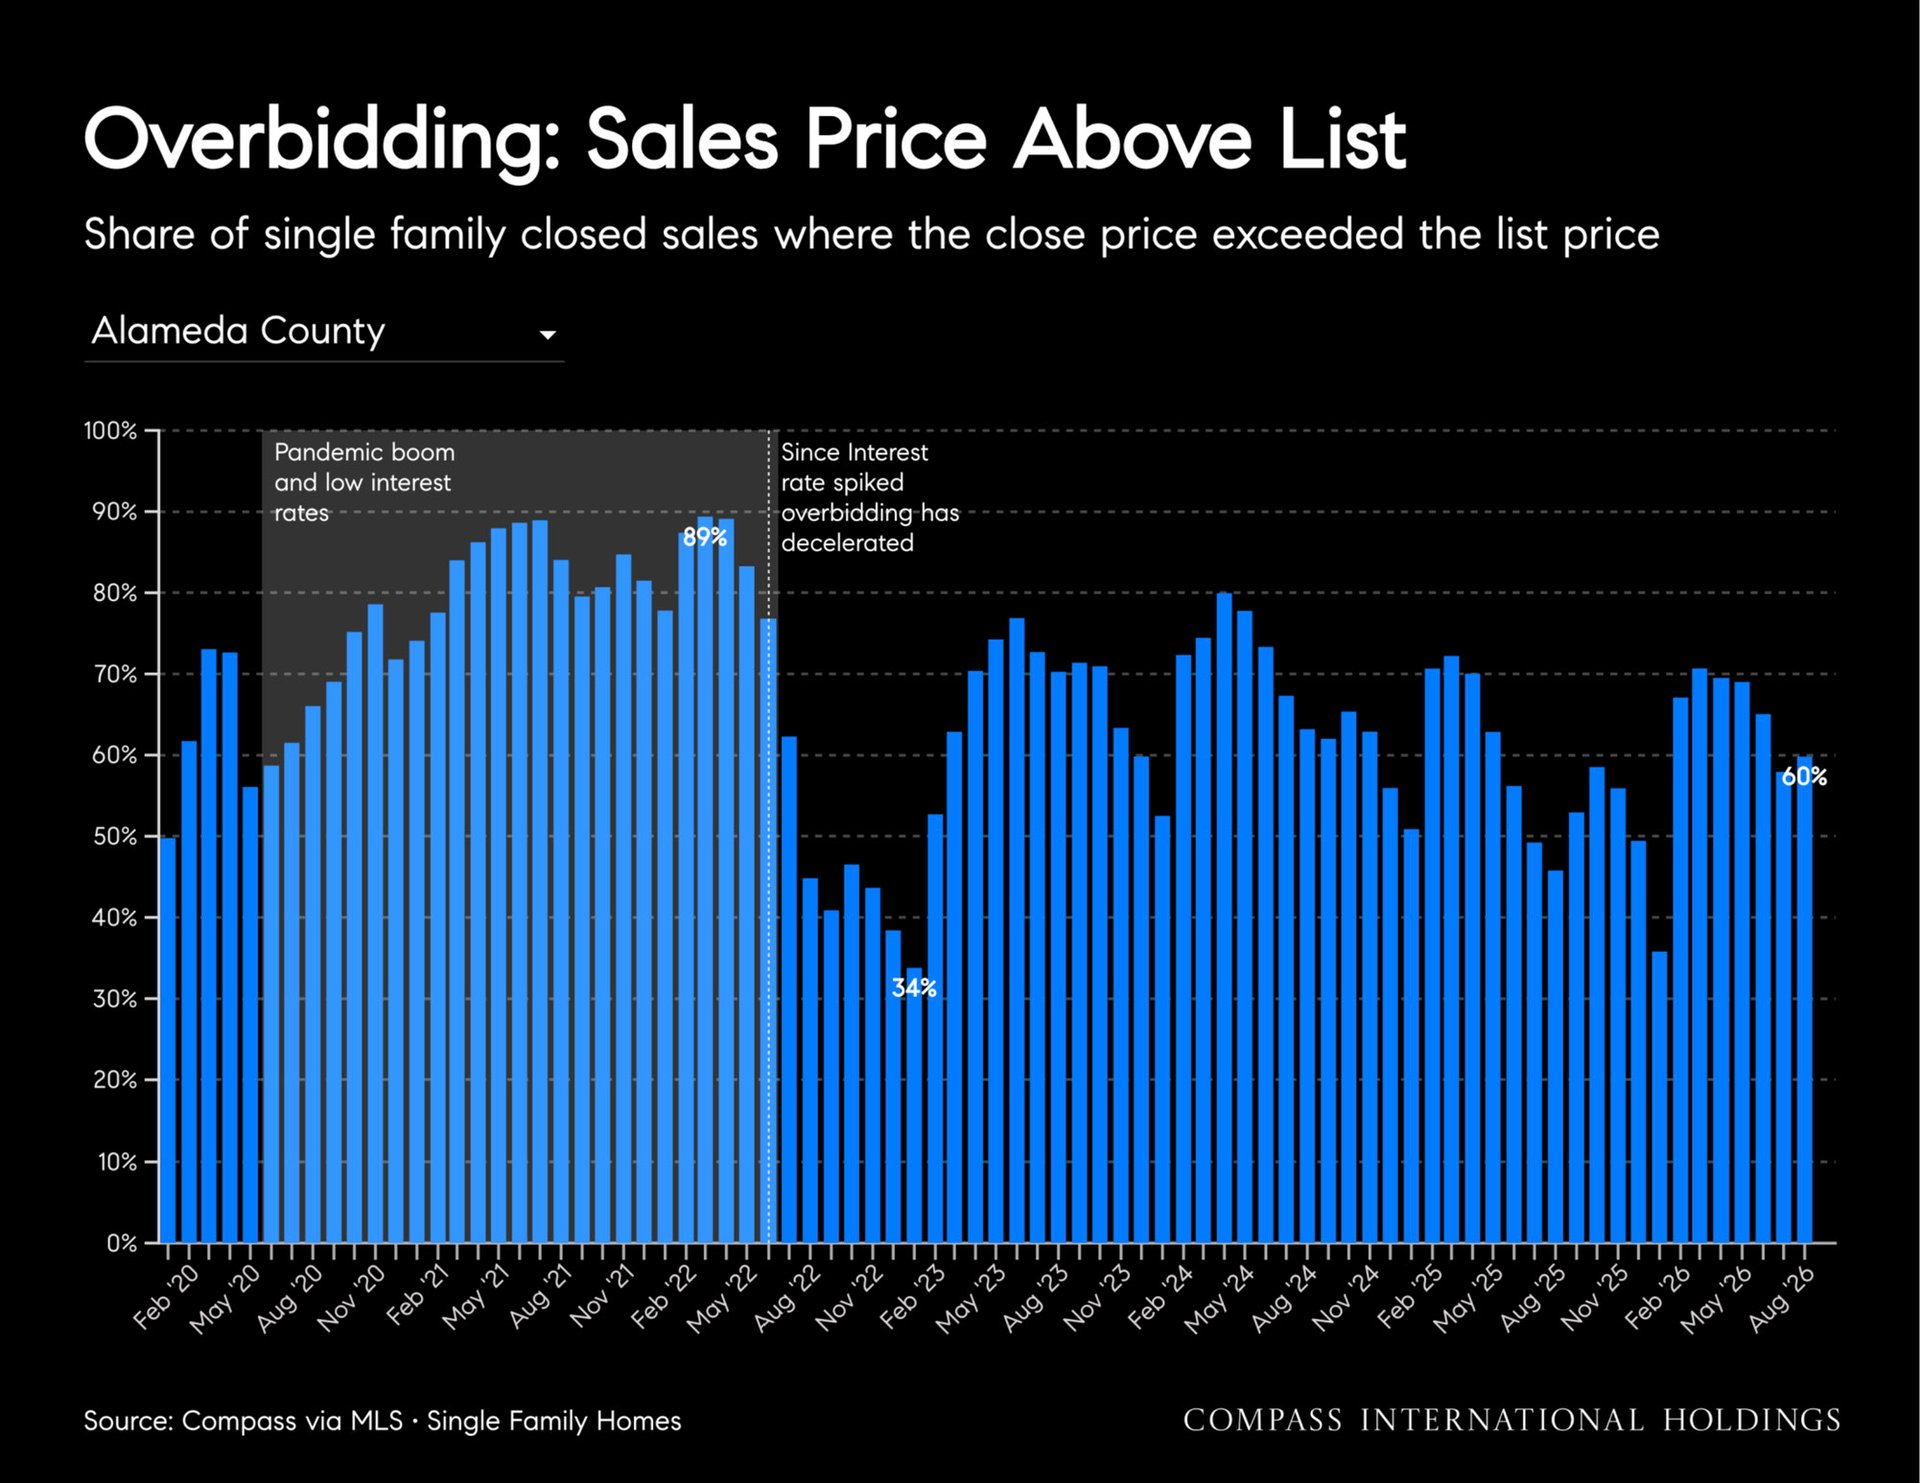
Approximately 60% of single-family homes sold above their asking price, up 13 percentage points year over year. Homes also spent an average of 28 days on the market.
For buyers, that means desirable homes can still attract significant competition even as overall transaction volume slows.
For sellers, pricing and preparation remain especially important. The broader market may be cooling seasonally, but buyers are still responding strongly to the homes they perceive as offering the right combination of location, condition and value.
Berkeley Continues to Stand Out
The differences become even clearer when we look at individual communities.
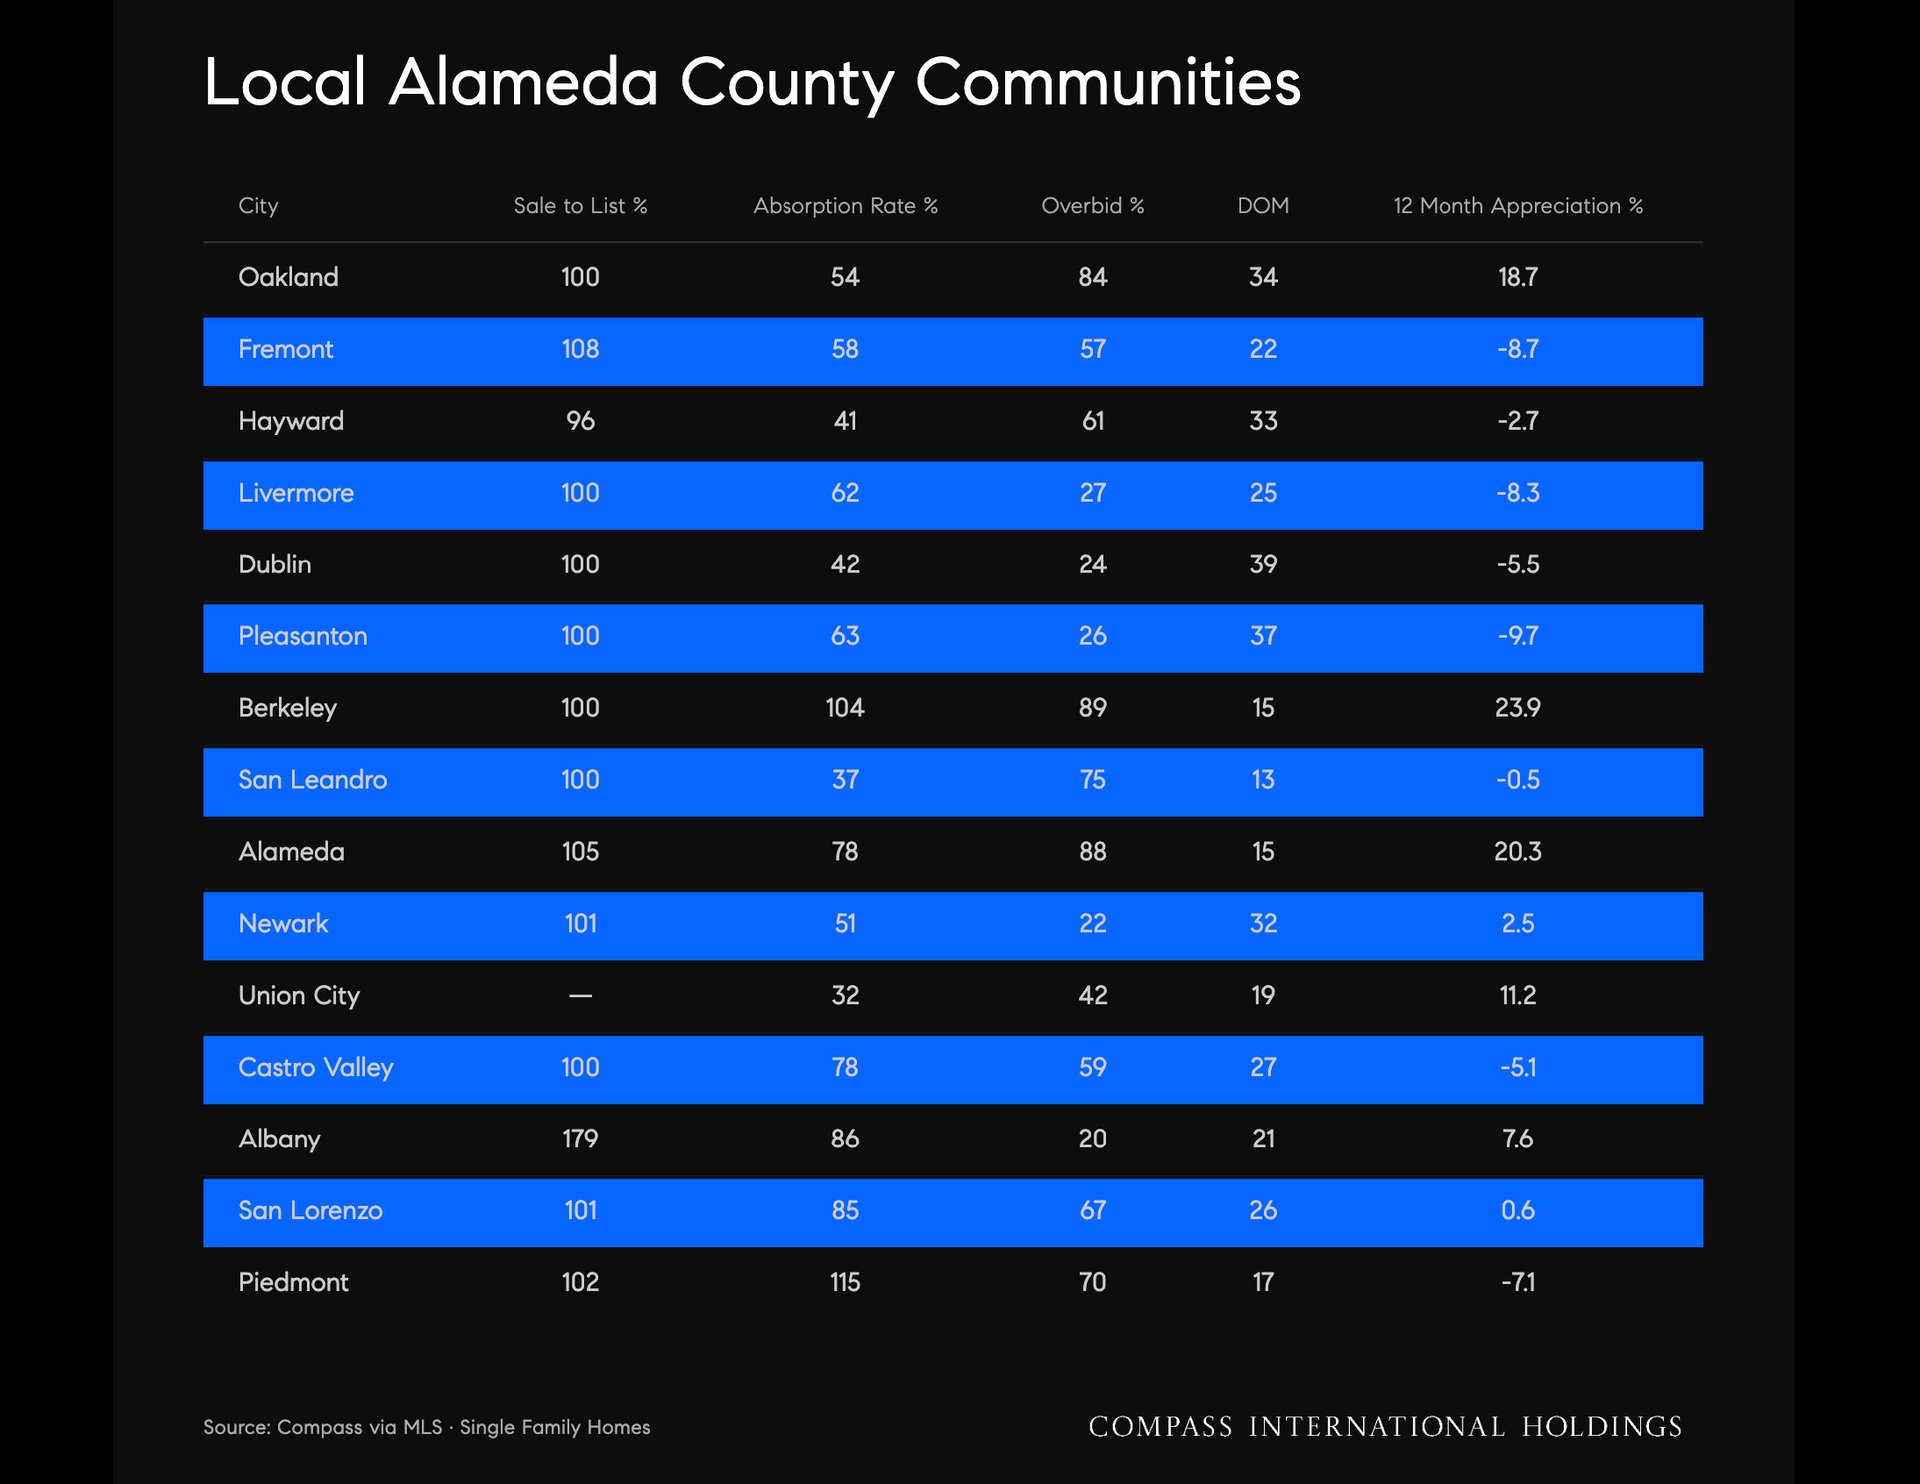
According to the report's local market table, Berkeley single-family homes had a 104% sale-to-list ratio and an average of just 15 days on market. The report also shows an 89% overbid rate for Berkeley.
Oakland, meanwhile, recorded a 100% sale-to-list ratio and an average of 34 days on market.
These figures illustrate why countywide statistics should always be paired with neighborhood-level context. What a buyer or seller experiences in Berkeley can be very different from conditions elsewhere in Alameda County.
Condos Are Telling a Different Story
The condo market is where we're seeing a clearer shift.
The Alameda County condo median reached $560,000, up 2% year over year, but other indicators point to softer conditions.
Condos averaged 48 days on market, compared with 28 days for single-family homes. Months of supply reached 4.2 months, while only about 27% of condo sales closed above asking.
Price reductions also increased.
For condo buyers, that may translate into more time to evaluate properties and potentially more negotiating room than buyers competing for desirable single-family homes.
For condo sellers, accurate pricing and strong presentation become increasingly important when buyers have more choices.
What This Means for East Bay Buyers and Sellers
The biggest takeaway from August isn't simply that the market is "up" or "down."
It's that the market is becoming increasingly property- and location-specific.
Single-family homes continue to attract meaningful competition, particularly in sought-after East Bay communities. At the same time, slower overall sales and softer condo conditions mean buyers may encounter very different negotiating environments depending on what and where they're buying.
As we move further into the fall market, understanding recent sales at the neighborhood level will be more useful than relying on countywide averages alone.
Thinking about buying or selling in Berkeley, Oakland, or the greater East Bay? We can help you understand what homes are actually selling for in your neighborhood and how current market conditions may affect your plans.
Market statistics based on the September 2026 Compass Alameda County Market Outlook, using data through August 2026. Market conditions vary by location, property type and price point.