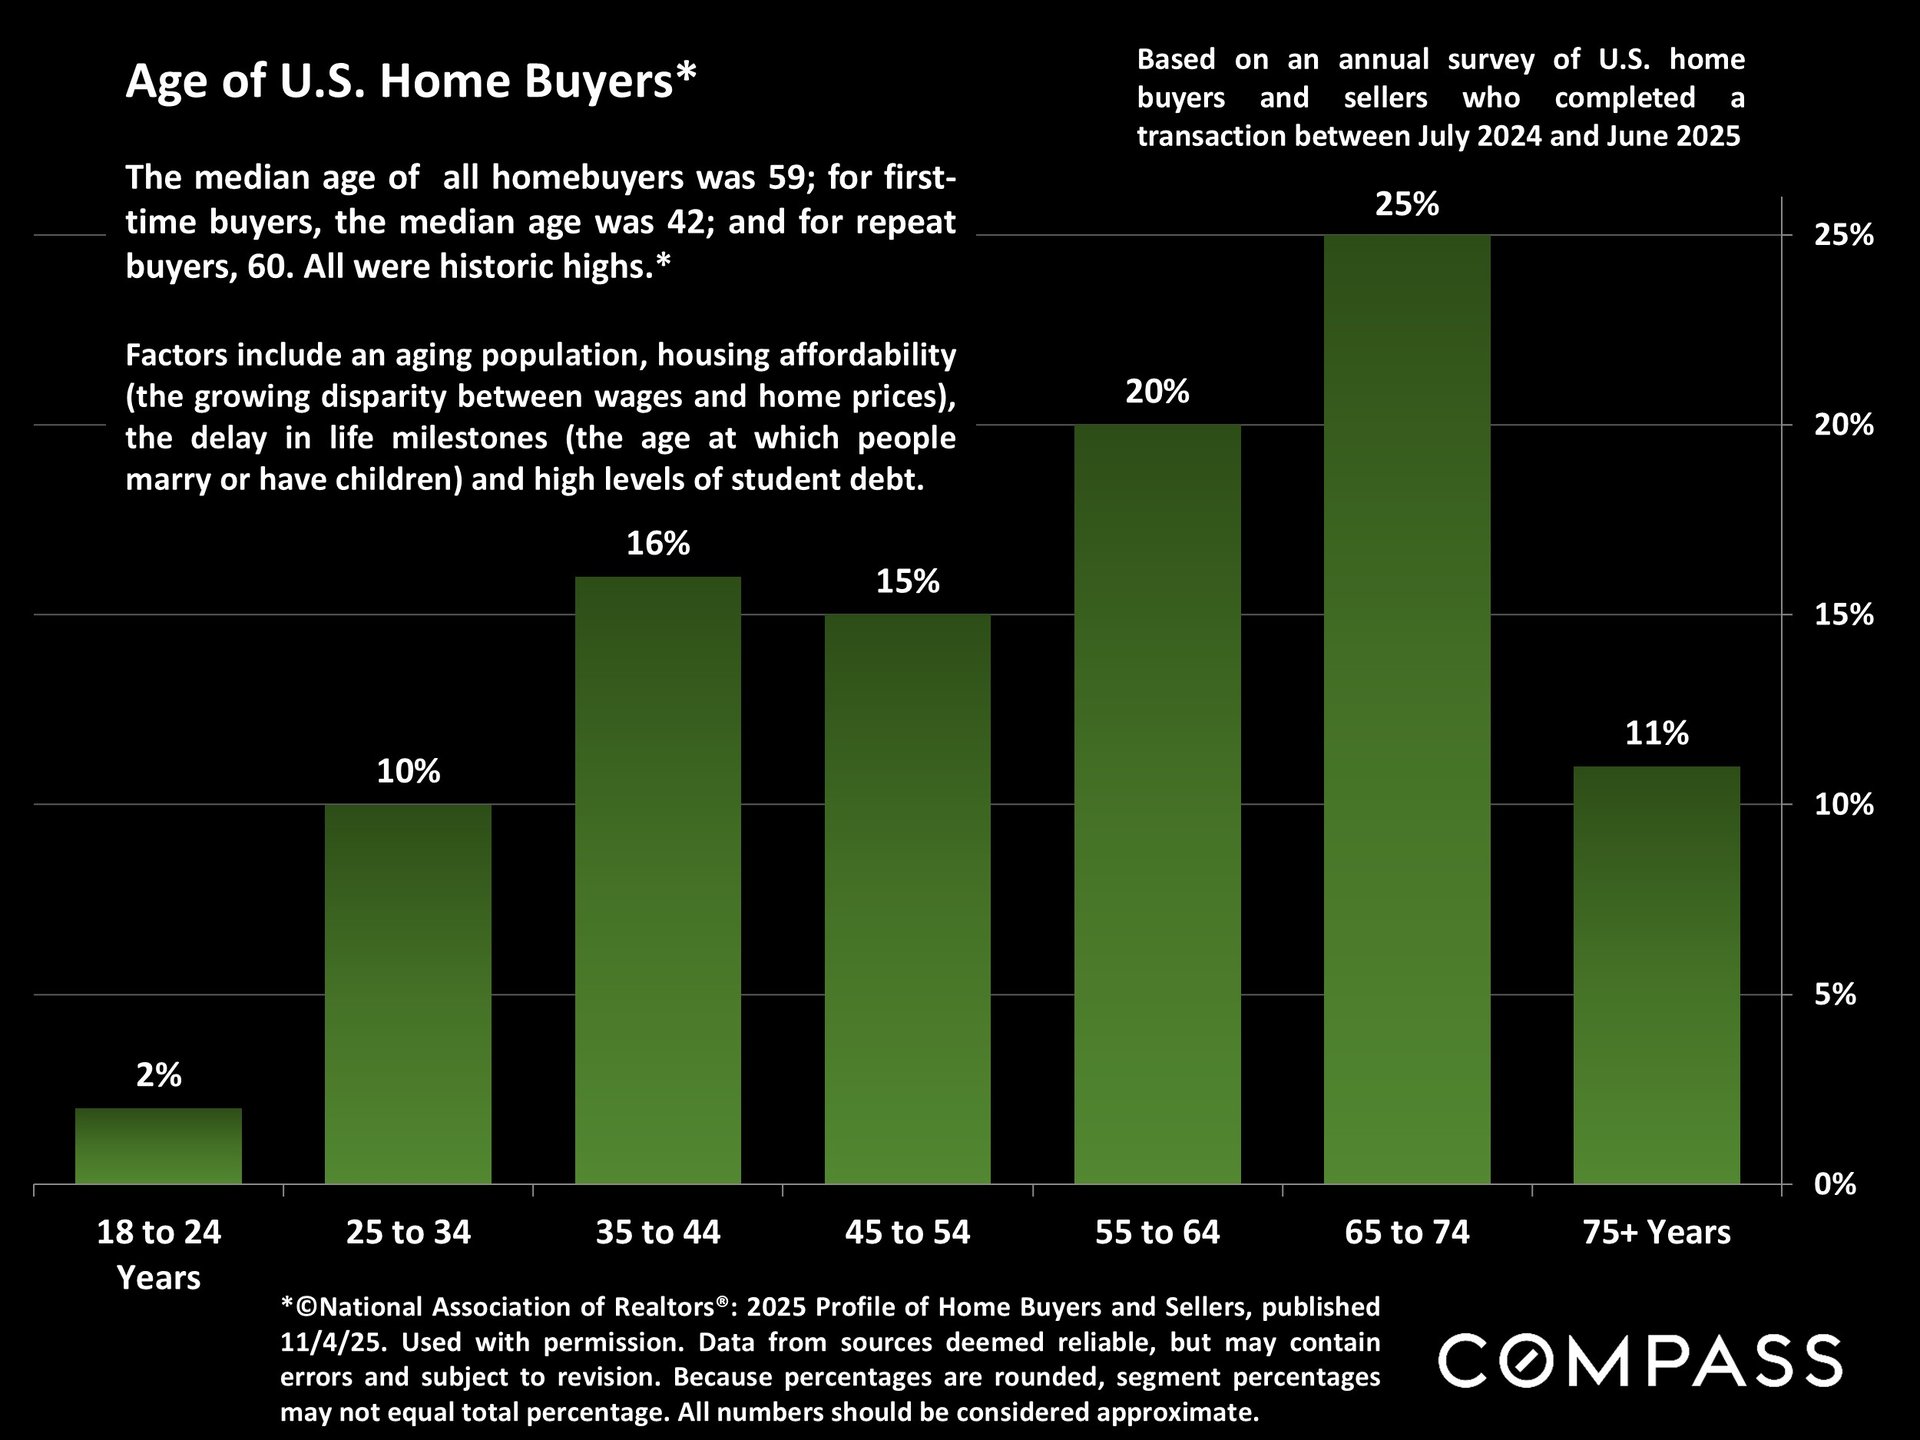
NAR just released their 117 page, "2025 Profile of Home Buyers and Sellers," with some interesting data, and I created a Compass flipbook of the highlights, which can be found here.
One chart from the flipbook - on how dramatically the housing market is shifting older - is below.
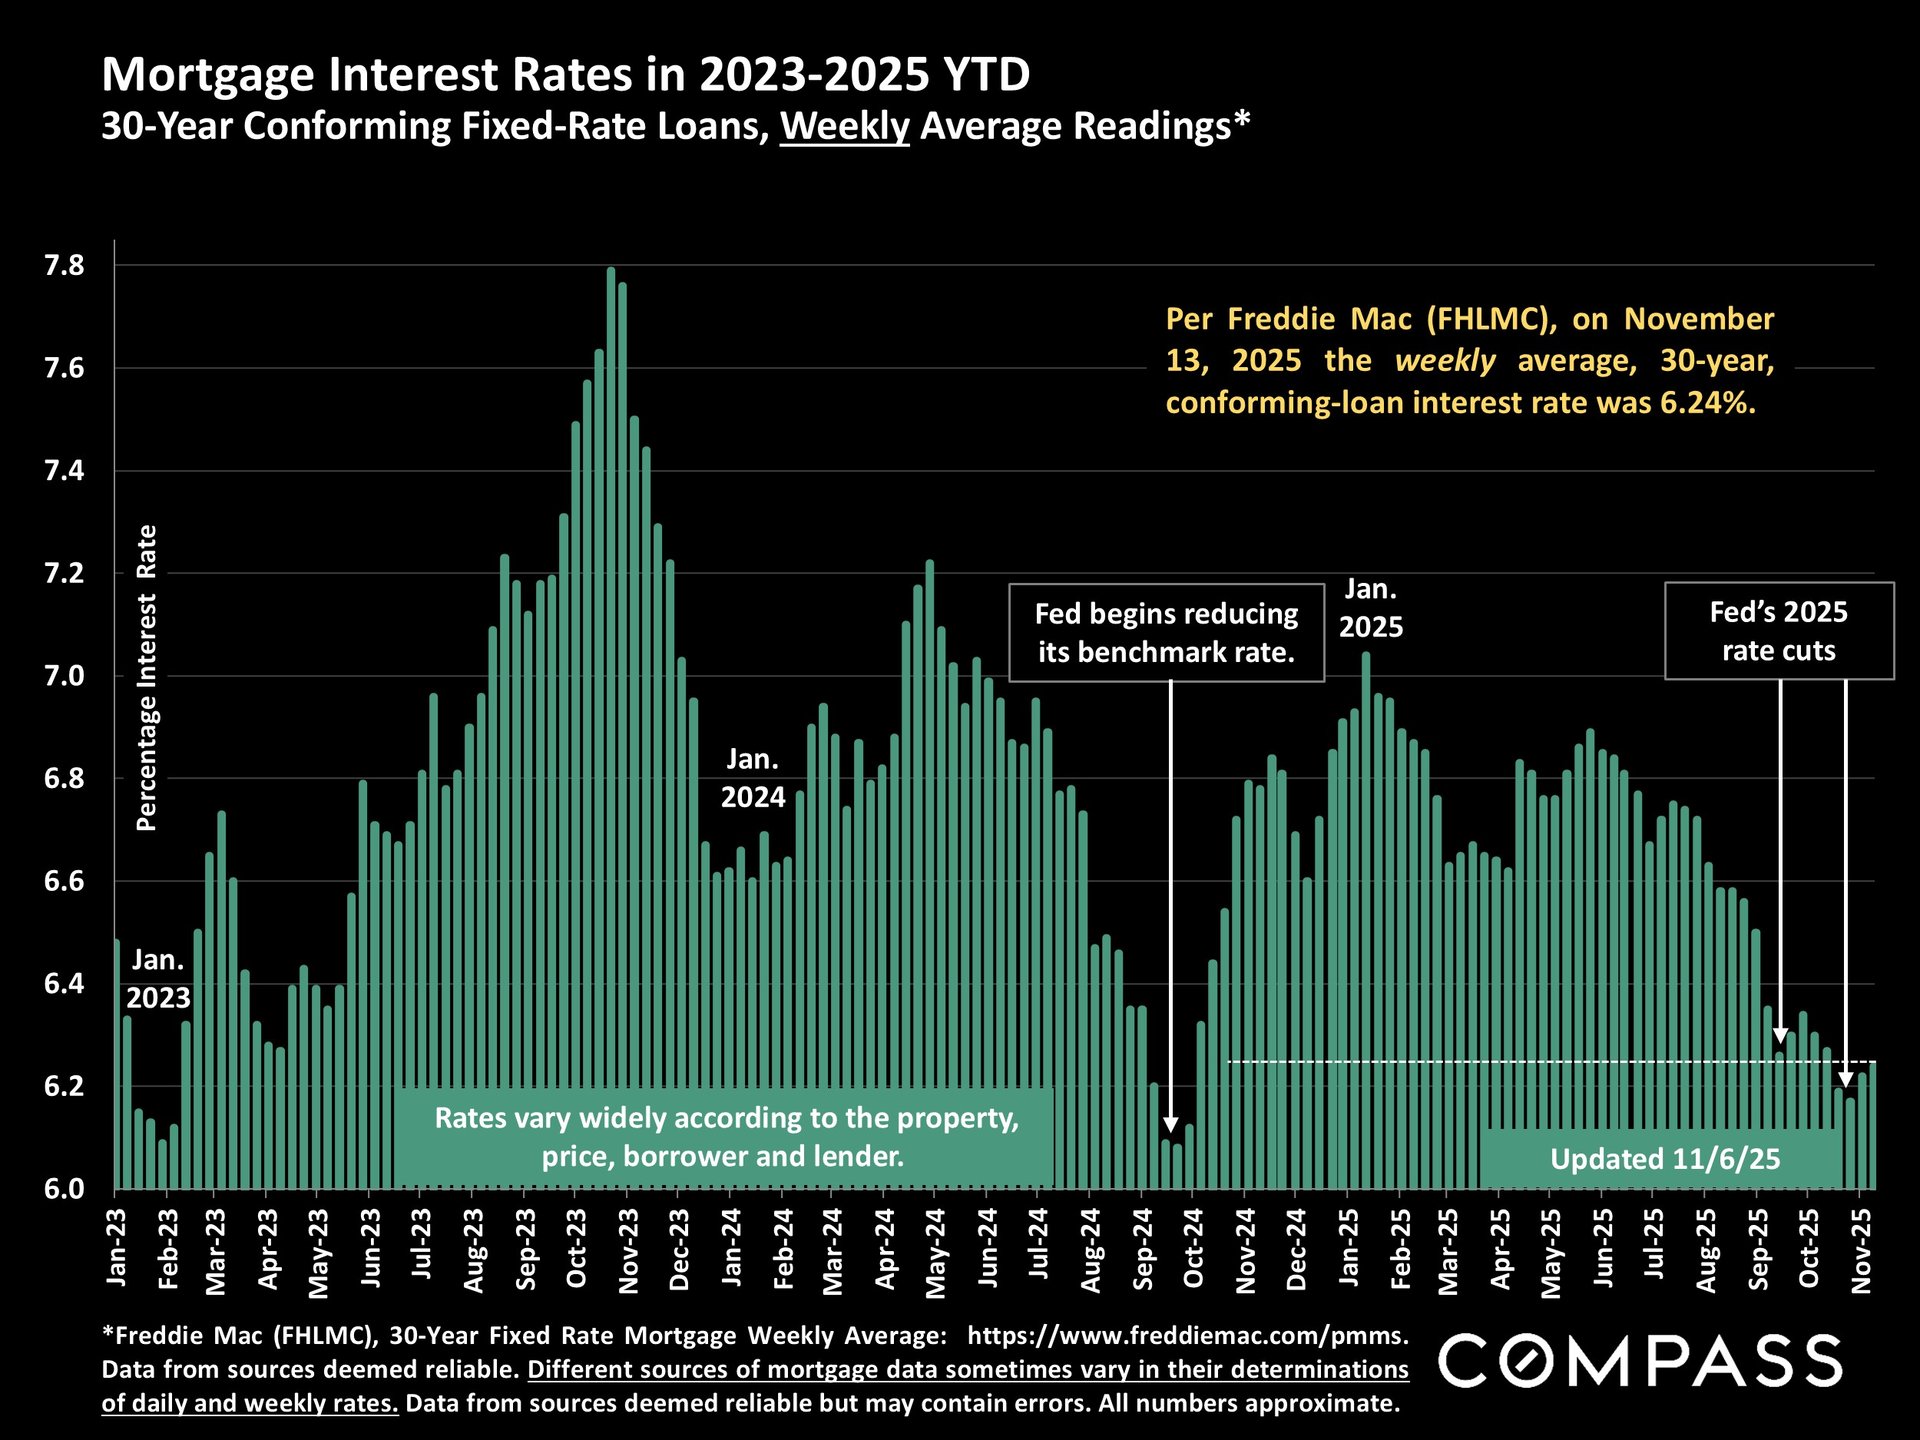
Mortgage interest rates were essentially unchanged from last week, still running much lower than in most of 2025.
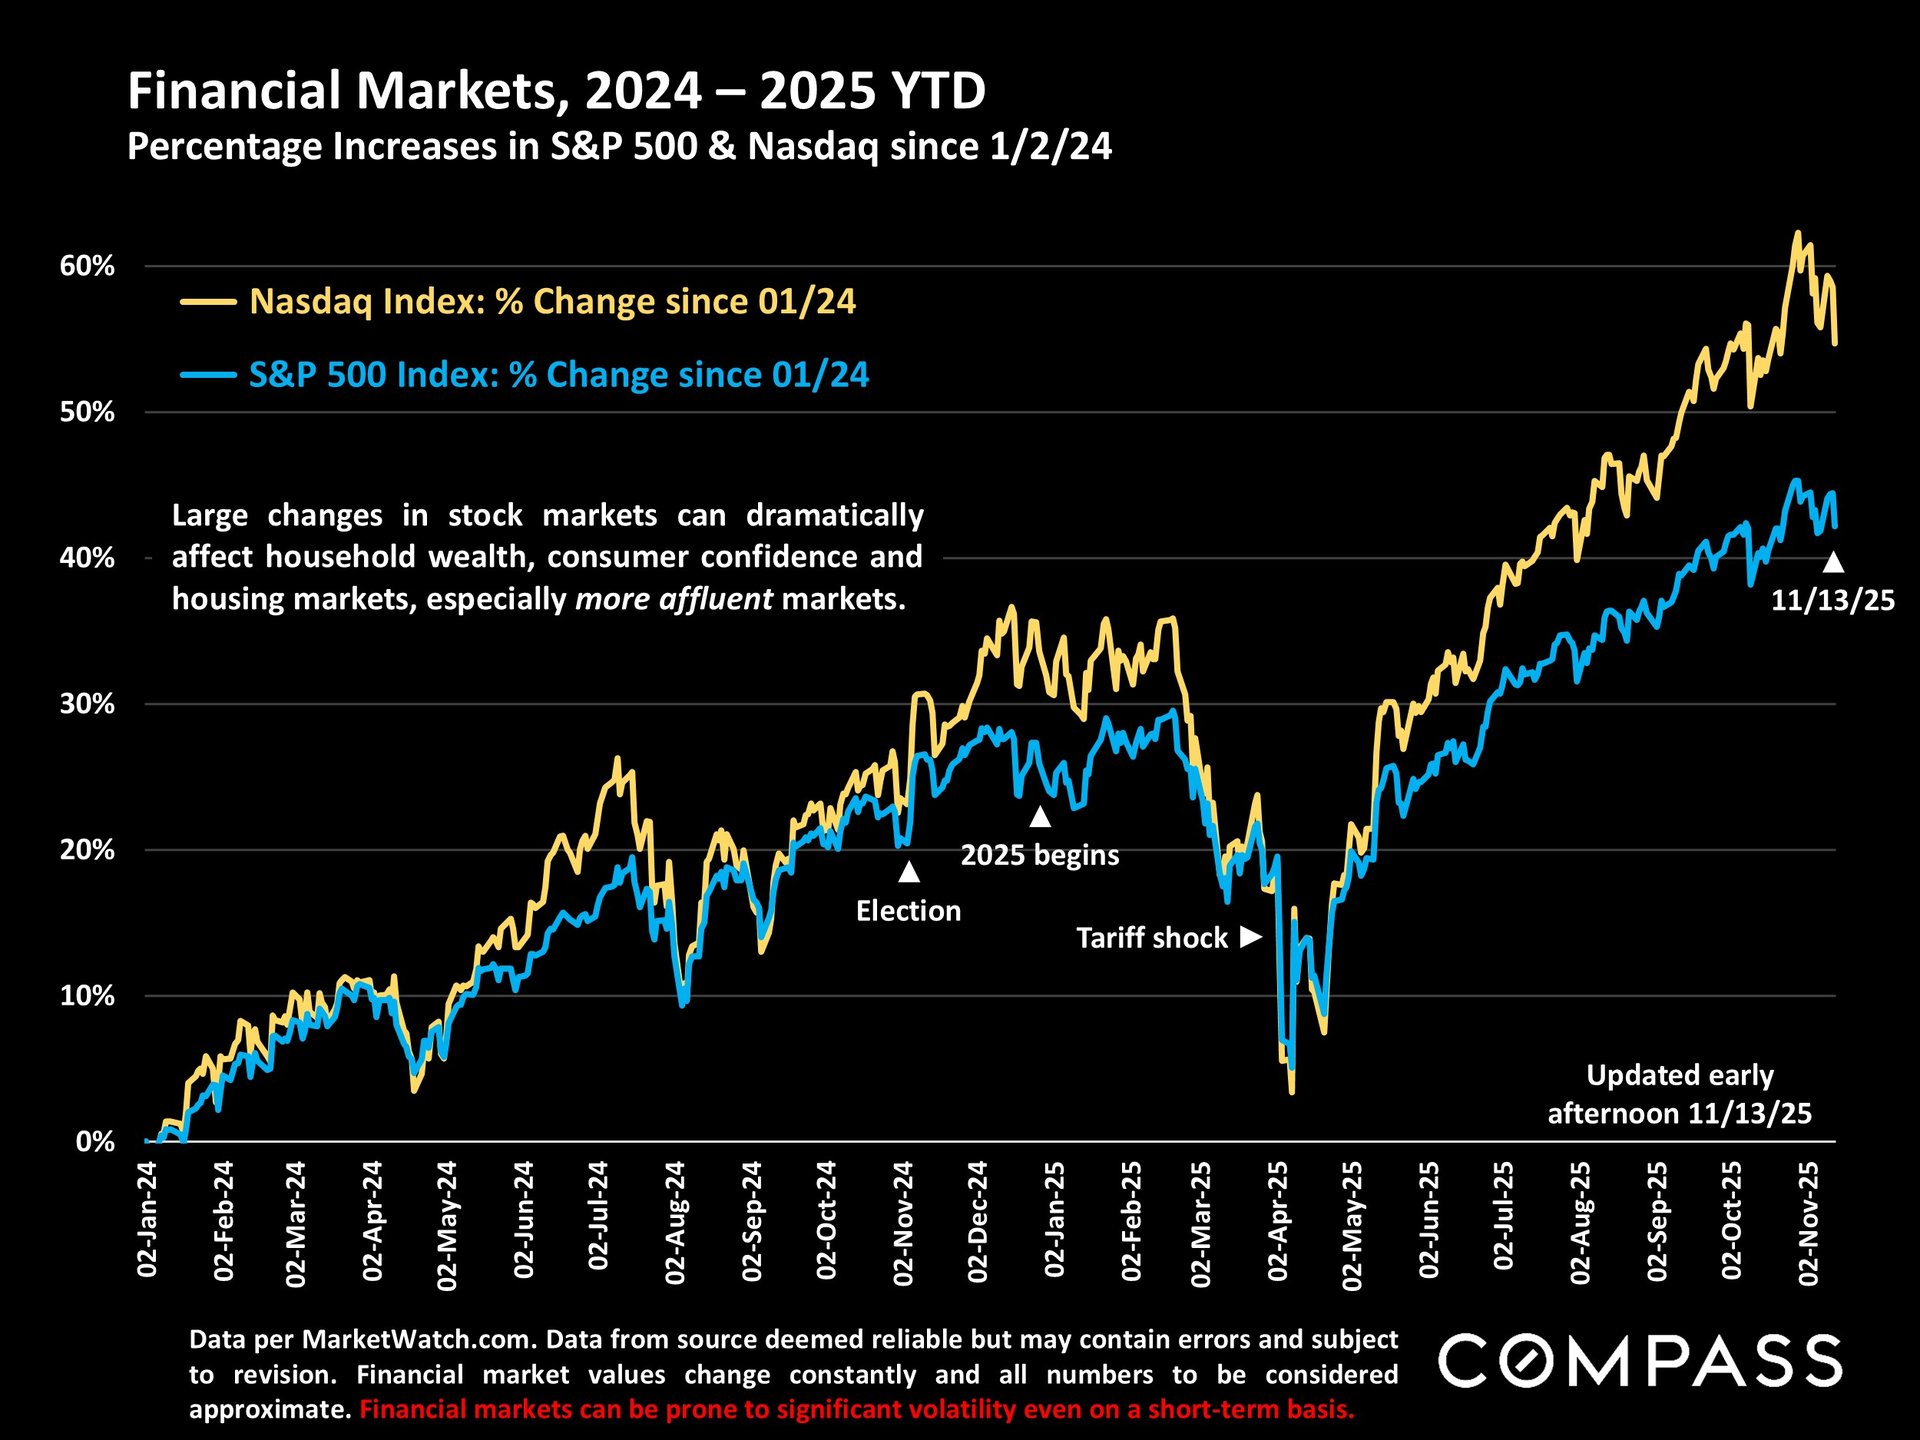
Stock markets have been a little rocky recently, but still running very high.
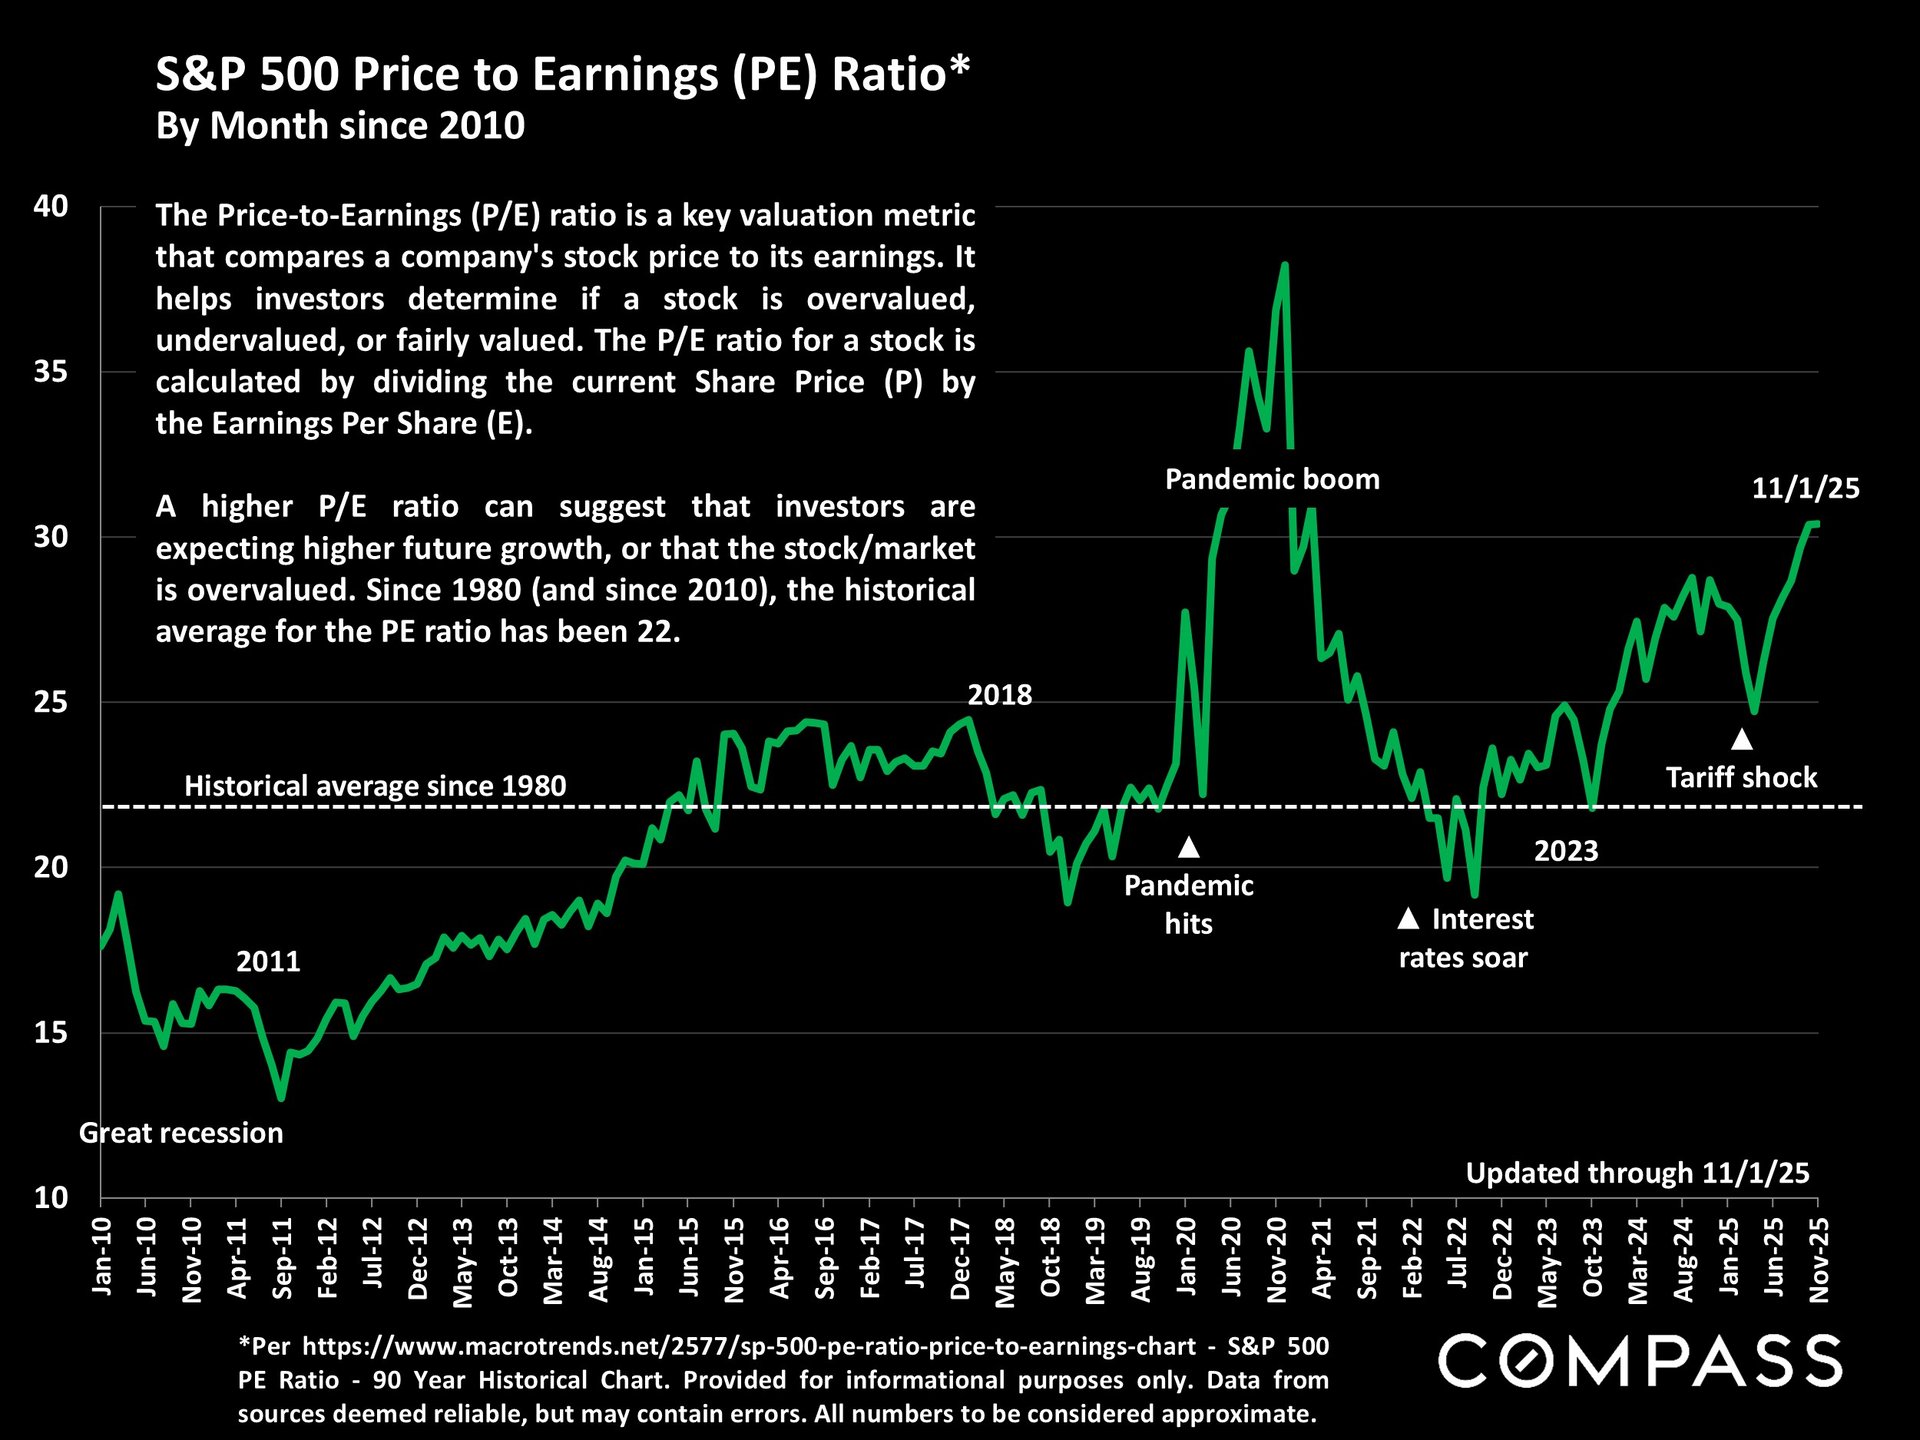
One of the ways that analysts evaluate stock market values is by the Price/Earnings (PE) Ratio, which has been running well above its long-term average, and is at its highest reading since the pandemic boom: See chart below. The Economist uses a somewhat different version of the PE Ratio, using "underlying, cyclically adjusted earnings," and in the 11/8/25 issue said, "To buy the basket of stocks in America's S&P 500 share index, investors now pay 40 times their underlying, cyclically adjusted earnings - a multiple exceeded only during the dotcom bubble, and then not by much." Their article was ominously titled, "Before the Fall." I am not expressing an opinion on the existence or not of a stock market or AI bubble: It is extremely hard to predict the peak of market booms, and there are a lot of dynamics at play.
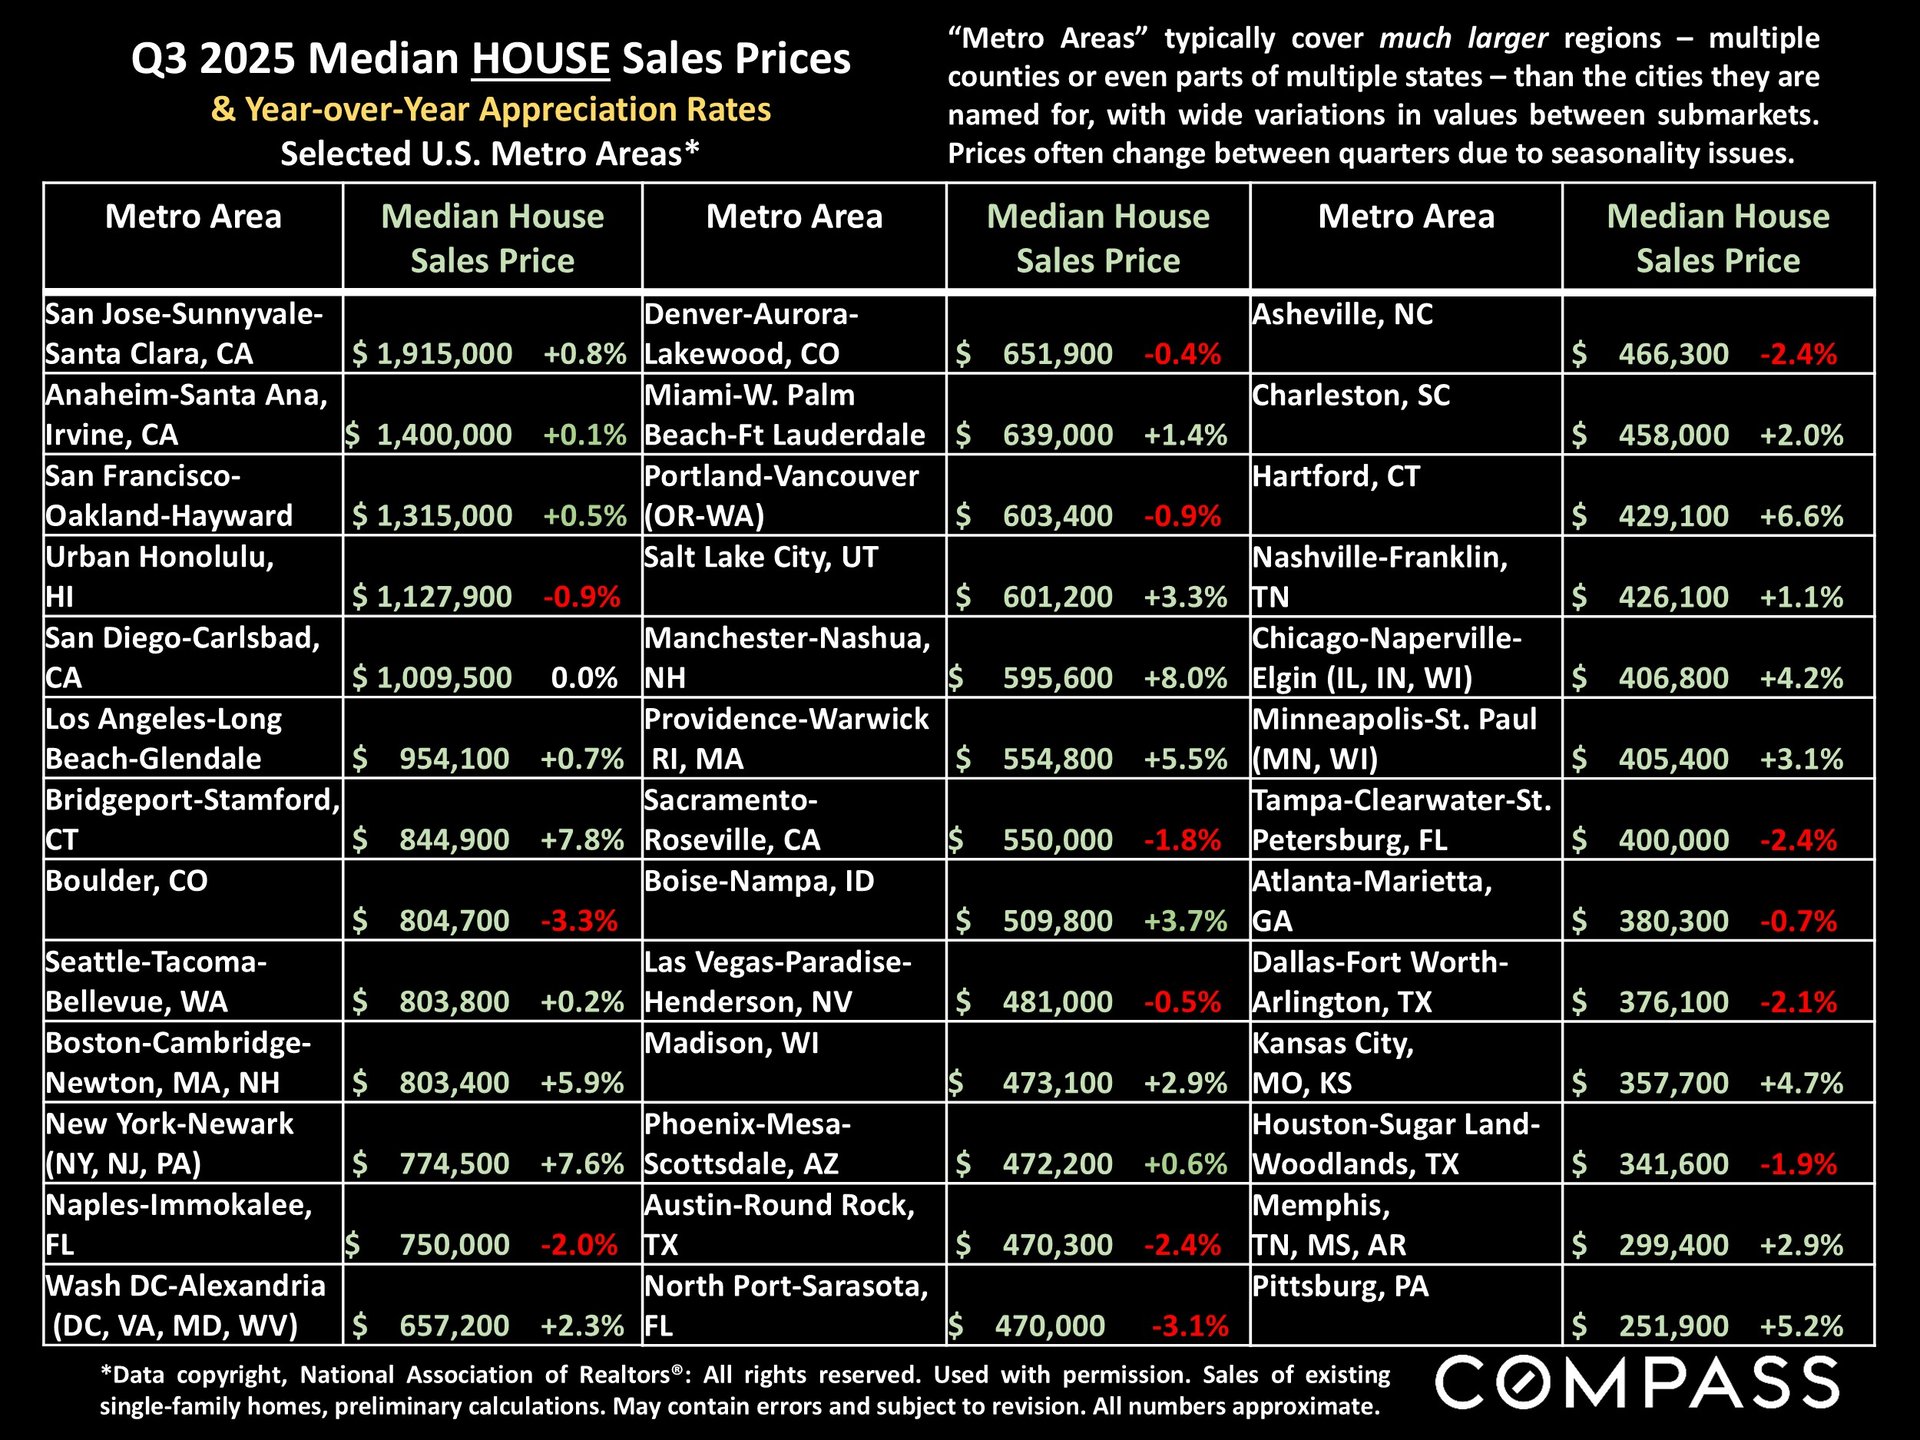
Data from the latest NAR Q3 2025 "metro-area" analysis of median house prices and year-over-year appreciation, for first houses and then condos/co-ops. As has been widely reported, significant appreciation is most commonly seen in the northeast and midwest - which have seen relatively little new-home construction in recent years - and declines are most commonly seen in the south/southeast, especially Florida and Texas, which have seen the greatest amount of new home construction in recent years, skewing the supply and demand dynamic. By the way, the WSJ had an article today, "Builders' Cheap Mortgages Are a Bad Deal for Home Buyers," alleging that "People who borrow from a builder are more likely to overpay for their property and be underwater [on their mortgage] after they move in."
Note that metro areas, which are defined by the federal government, typically contain multiple counties, and sometimes parts of multiple states. For example, the San Francisco metro area contains 5 counties of widely different values (and its house sales are dominated by the 2 counties with the lowest median house sales prices). These are very broad calculations.
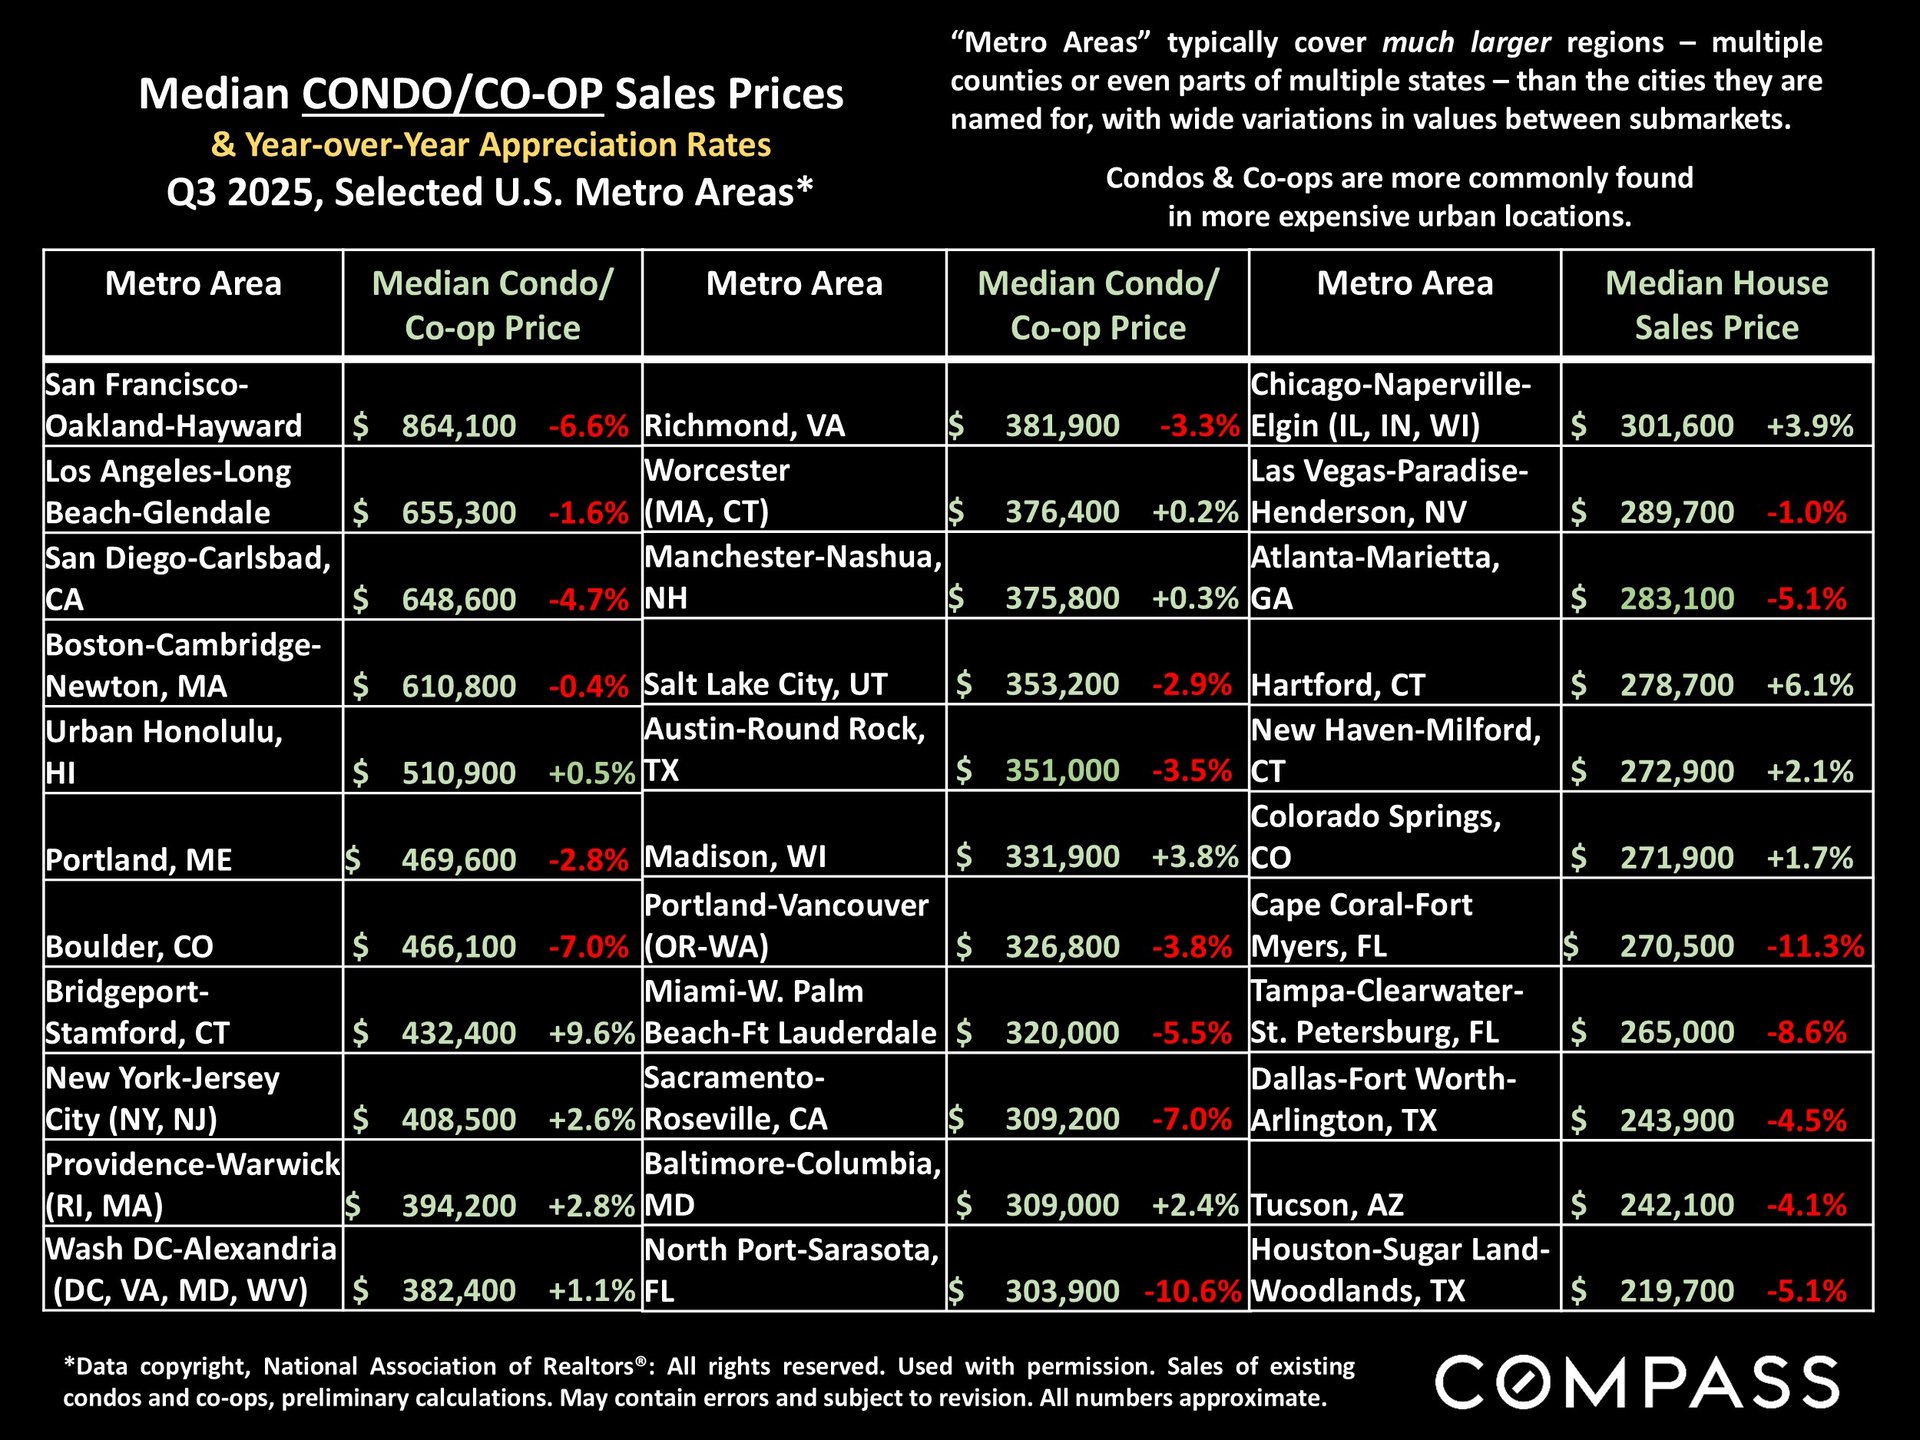
Year-over-year declines in median condo/co-op sales prices are much more common than in house markets, but again, the northeast is generally bucking that trend.
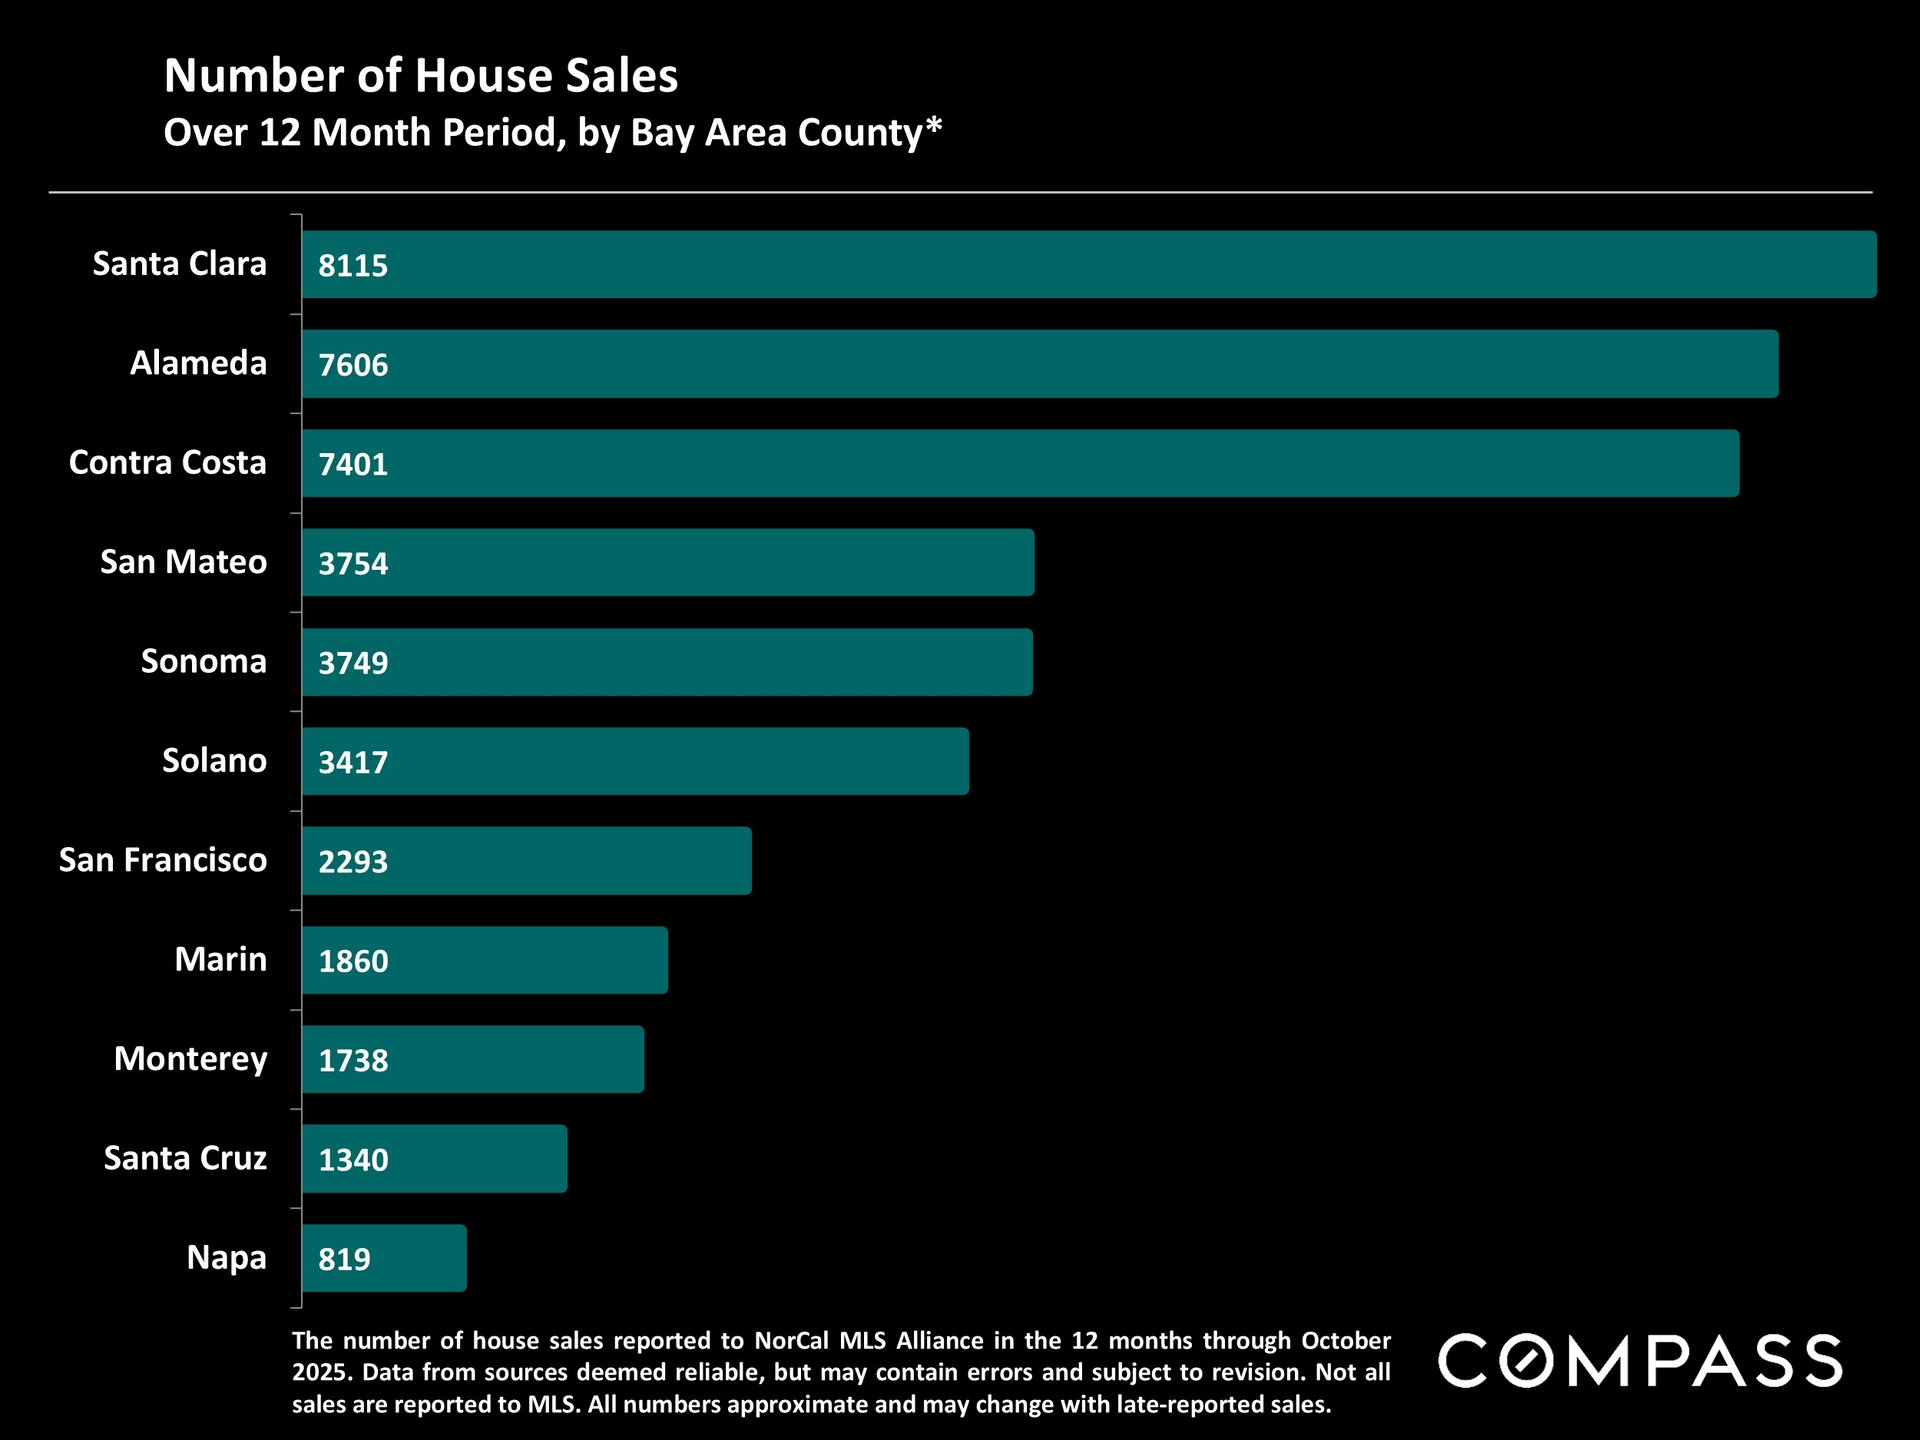
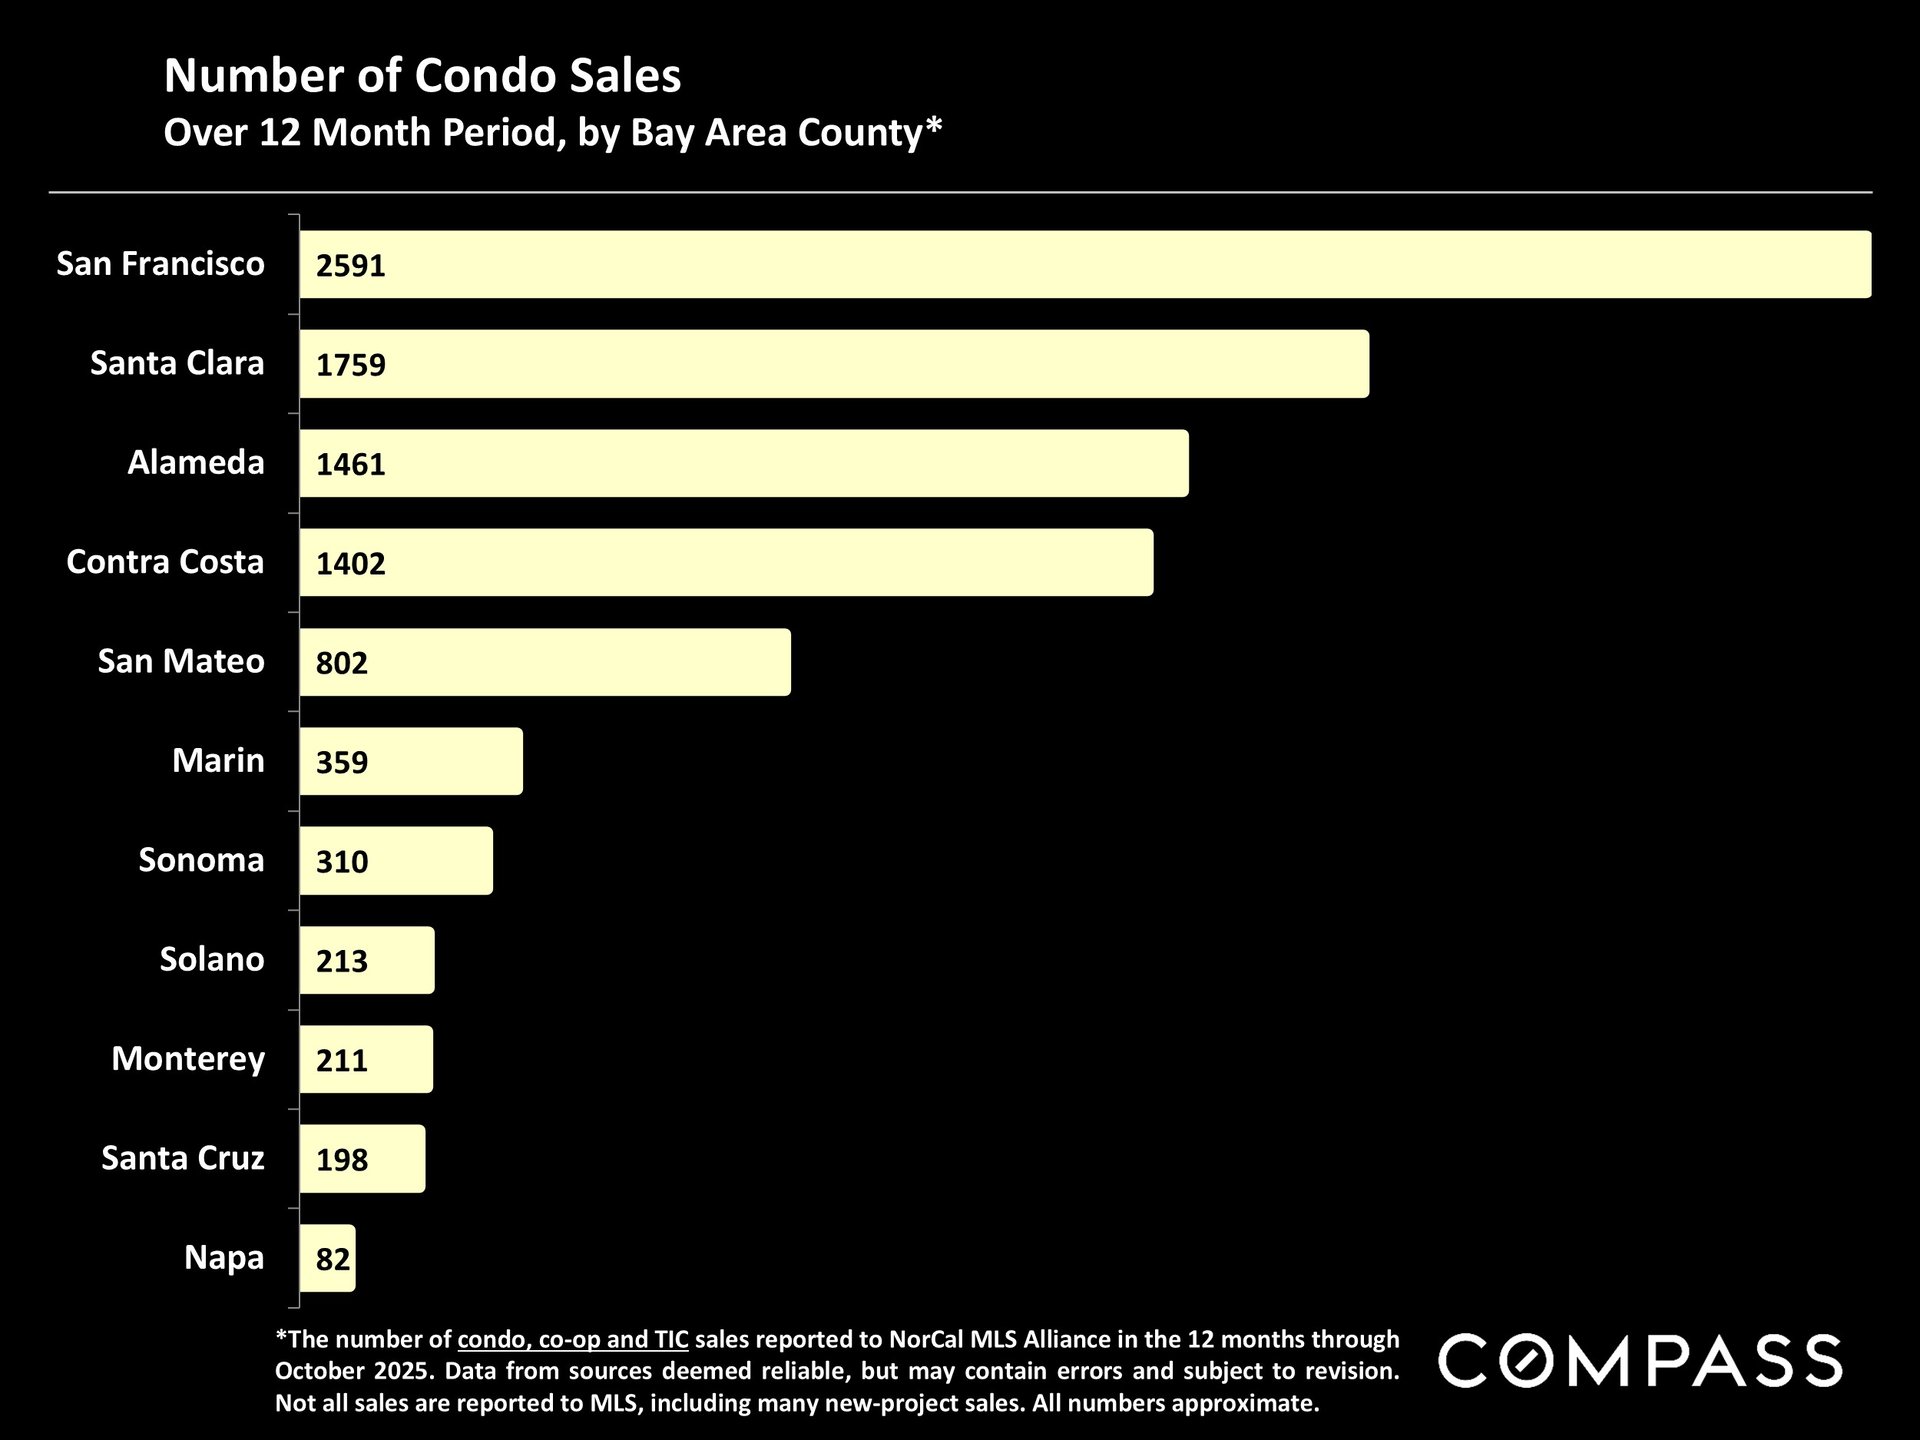
Comparing house and condo sales volumes across Bay Area Counties. Most people don't realize, for example, what a small house market San Francisco has: Less than 2300 sales in the last 12 months, spread across 70+ neighborhoods. When demand rises - as it is now due to the AI start-up boom - and inventory falls, as is occurring, it can become highly pressurized very quickly.
This next chart includes condo-like units, such as TICs and co-ops.
From John Burns Research, 11/12/25: "High-income job losses will reshape housing demand: The job market drives housing demand, but the type of jobs created or lost impacts the type of housing. High-income sectors—Information, Professional Services, and Financial Activities—are shrinking across most major metros. Workers in these industries drive for-sale housing demand more than rental demand. Nationally, high-income sector employment remained flat YOY in August, well below its long-term compound annual growth of +1.6%." I can't say whether their concerns are legitimate or overblown.
Consumer debt stress levels continue to increase. Debt, leverage, investor exuberance, (corporate fraud), and new, extremely complicated, financial instruments that few understand, often play big roles in market adjustments. At this point, consumer debt levels are probably most affecting those who might otherwise be potential first-time homebuyers.
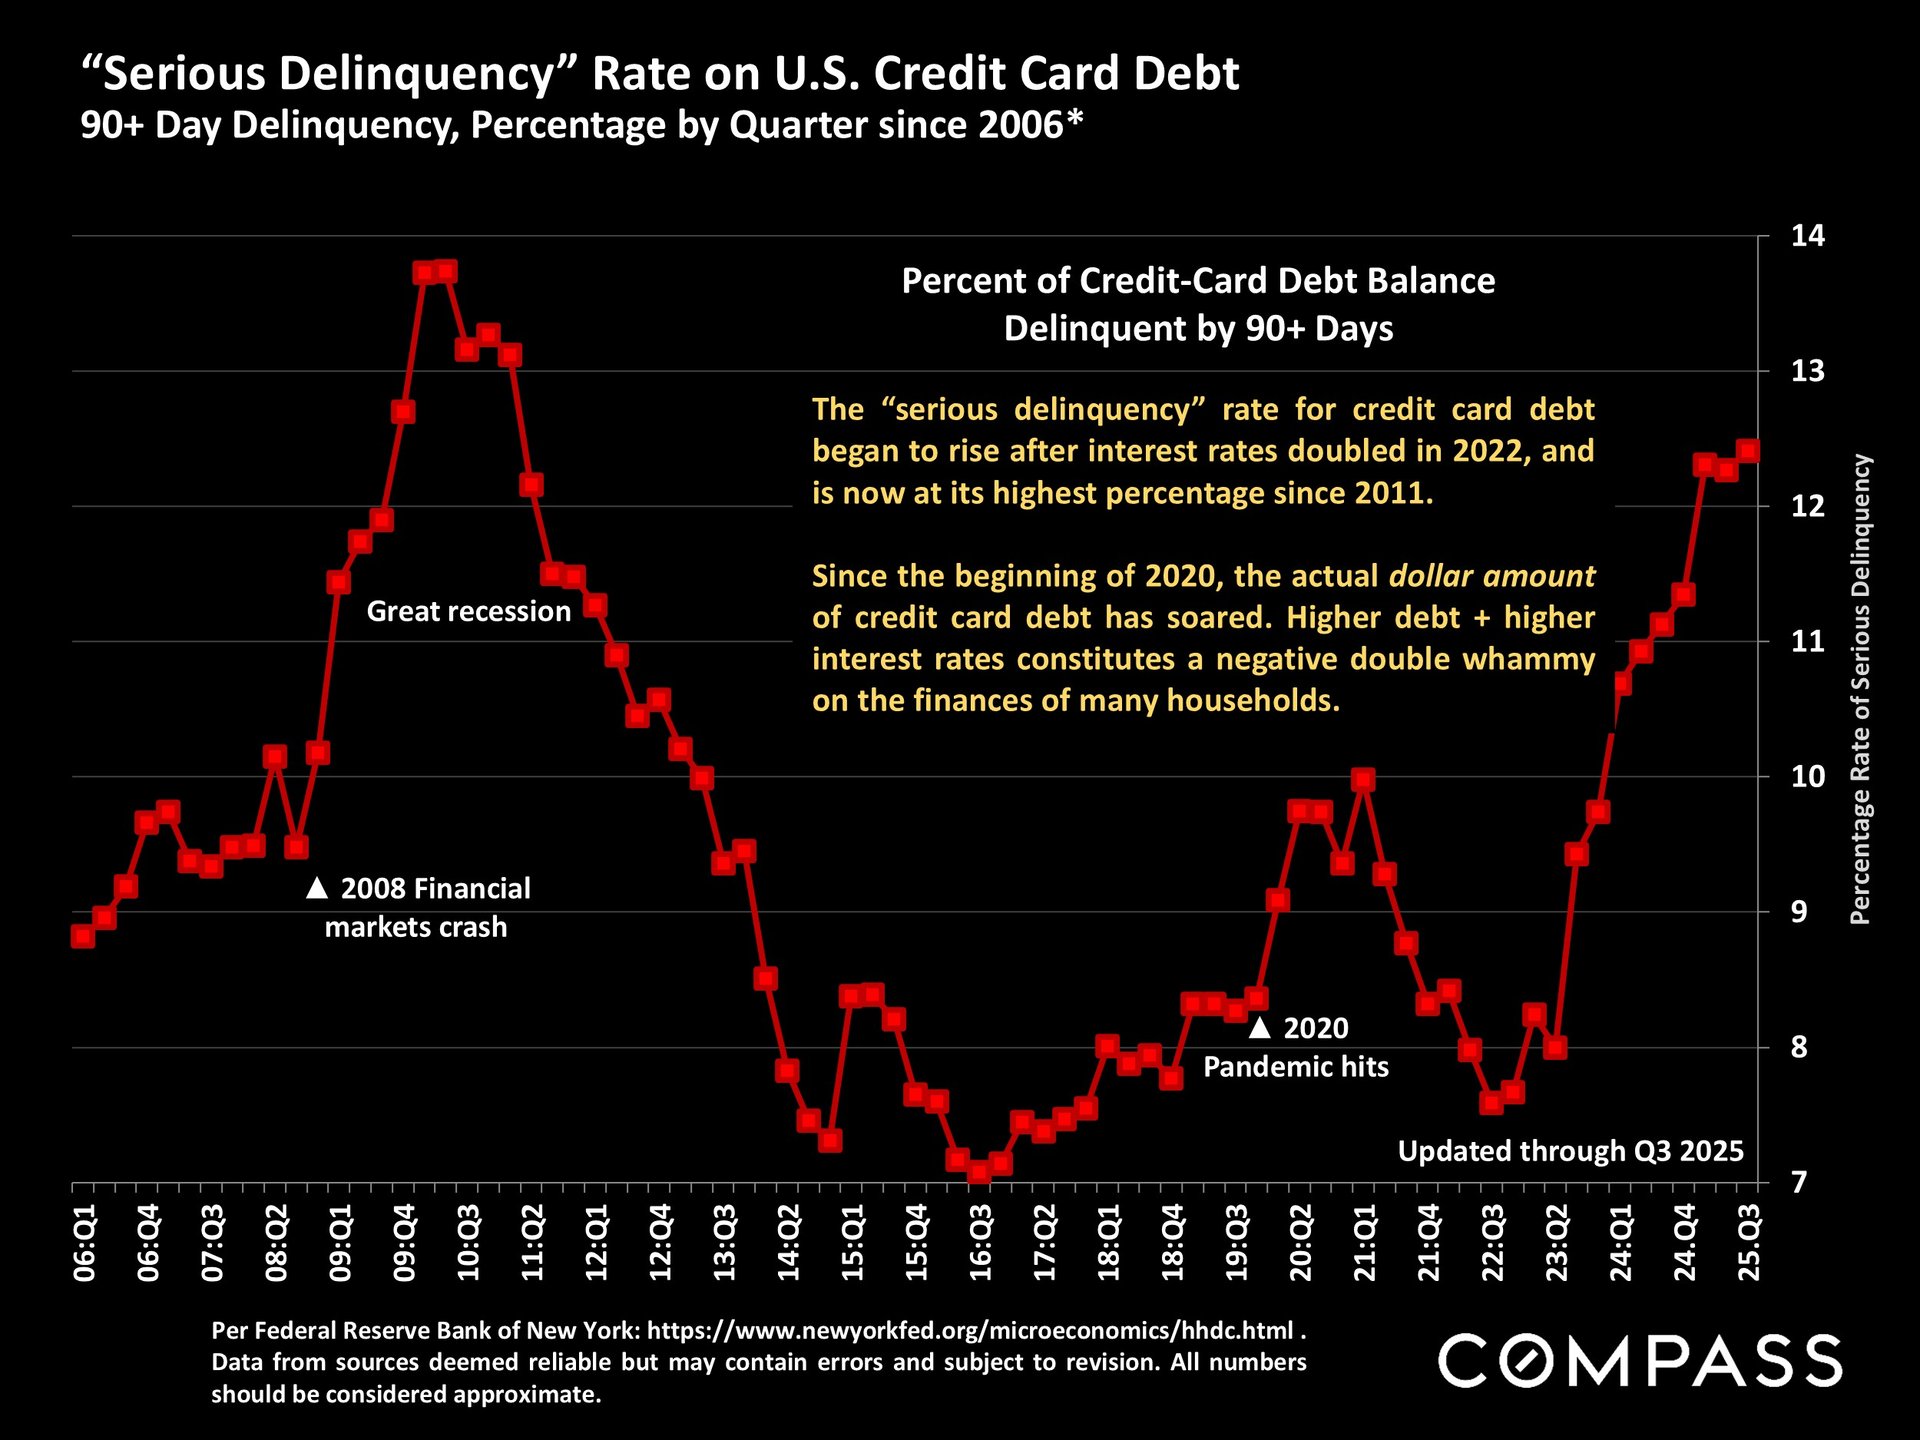
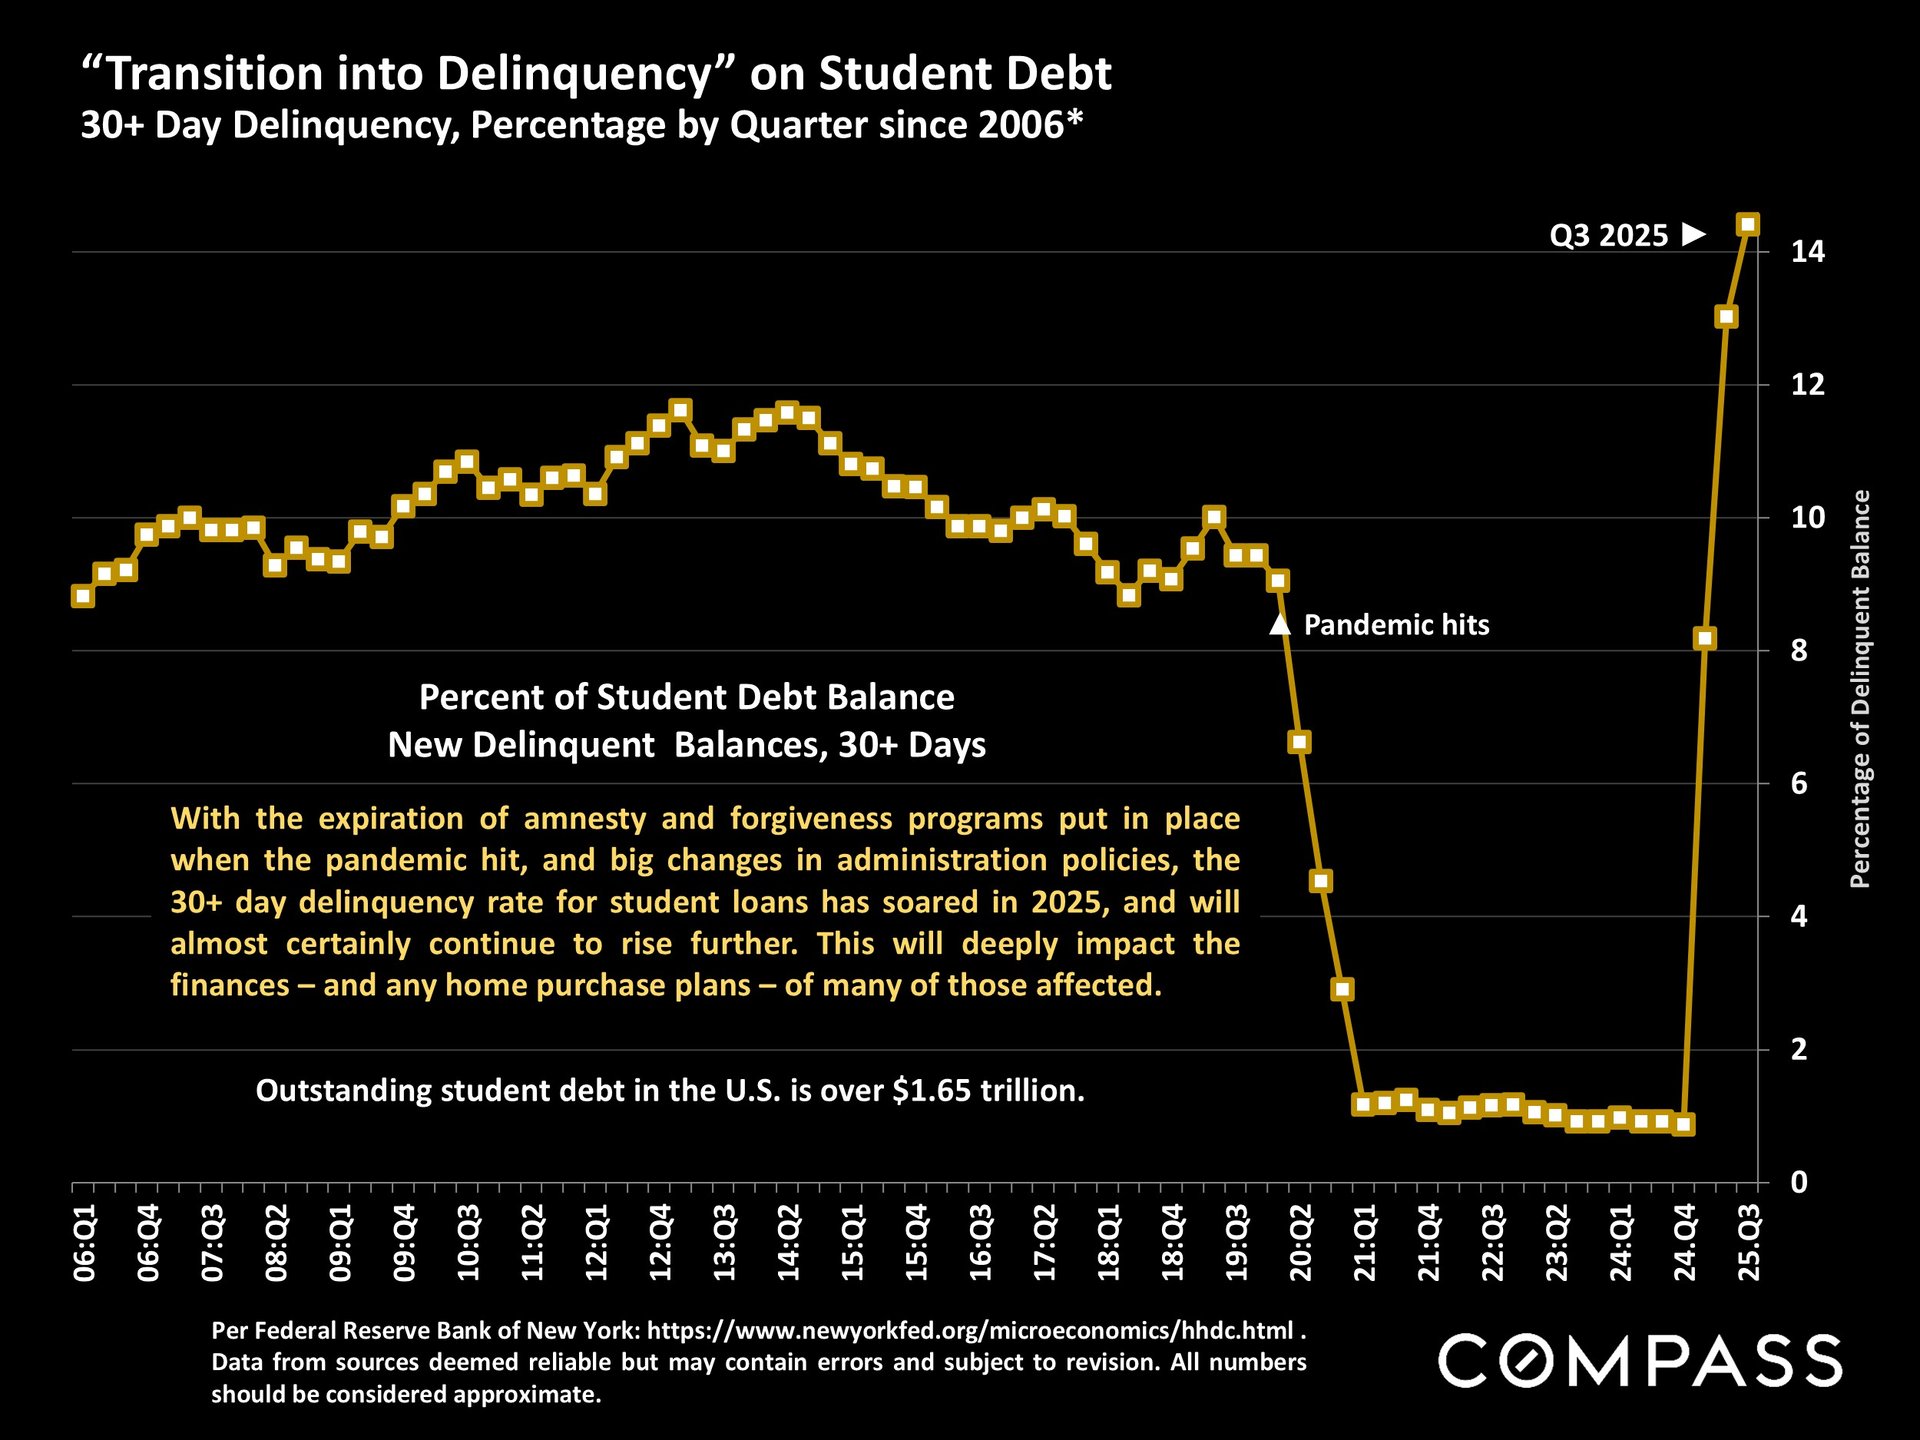
From Bloomberg News, 11/12/25: "The share of subprime borrowers at least 60 days past due on their auto loans rose to 6.65% in October, the highest in data going back 31 years." Of course, subprime borrowers typically play negligible roles in most of our housing markets.
The statistics in the next chart, based on Federal Reserve data, refer to 2024 - and, according to Consumer Sentiment readings, feelings of financial insecurity have increased in 2025. But there are big differences between the affluent - many of whom are apparently singing "Happy Days," - and the less affluent, who are increasingly facing challenging economic circumstances.
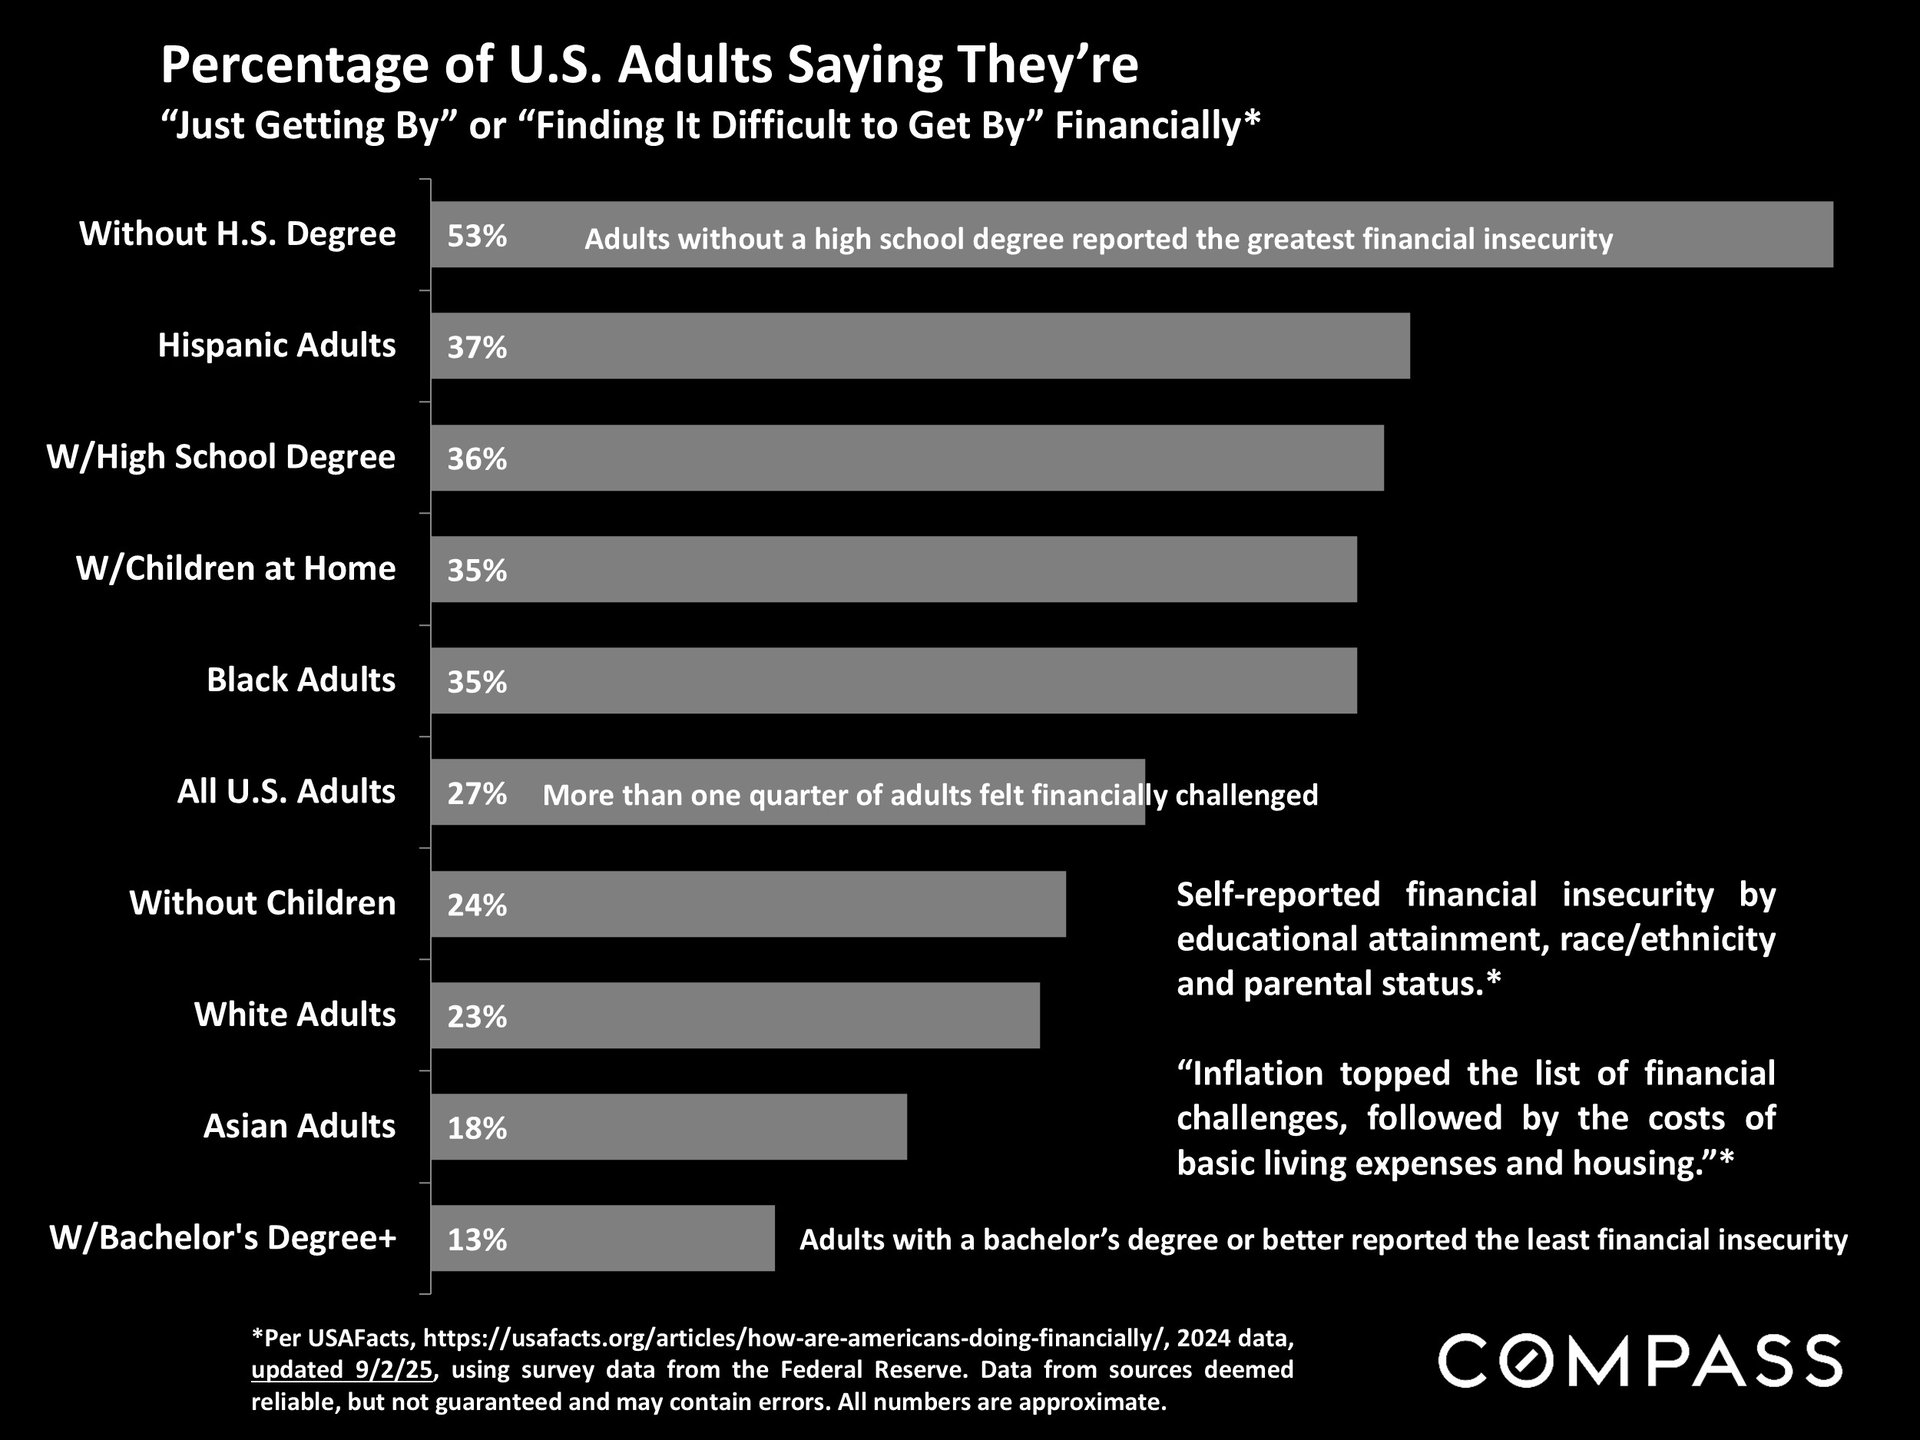
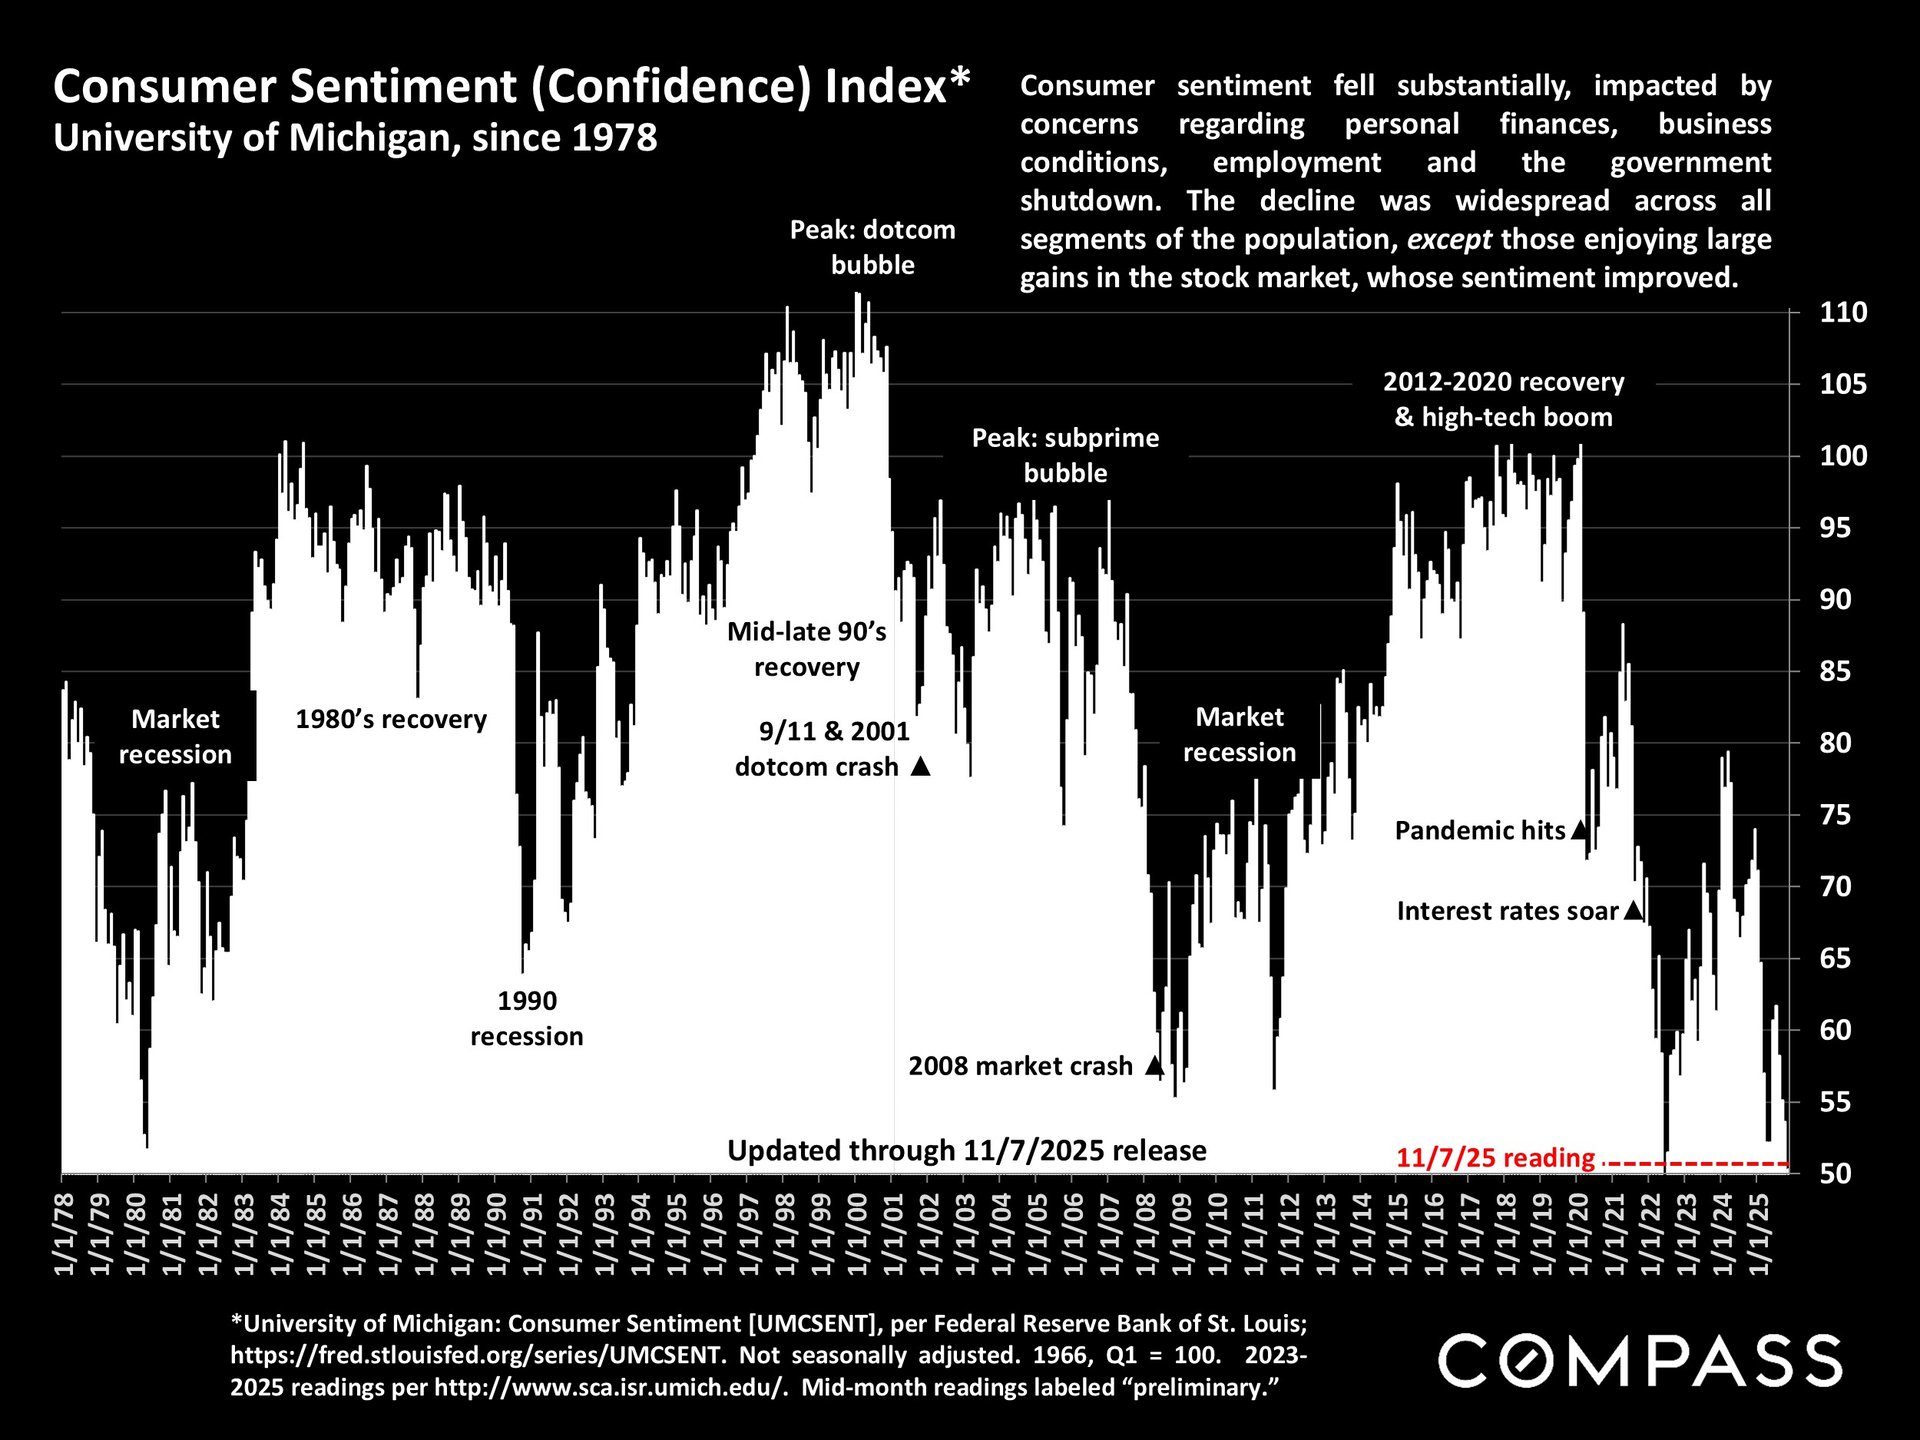
The Consumer Sentiment reading has dropped to an almost historic low, but, as mentioned above, there is a very substantial divergence in economic attitudes between affluent households invested in stock markets - who play a dominant role in many of our markets - and the rest of the population.
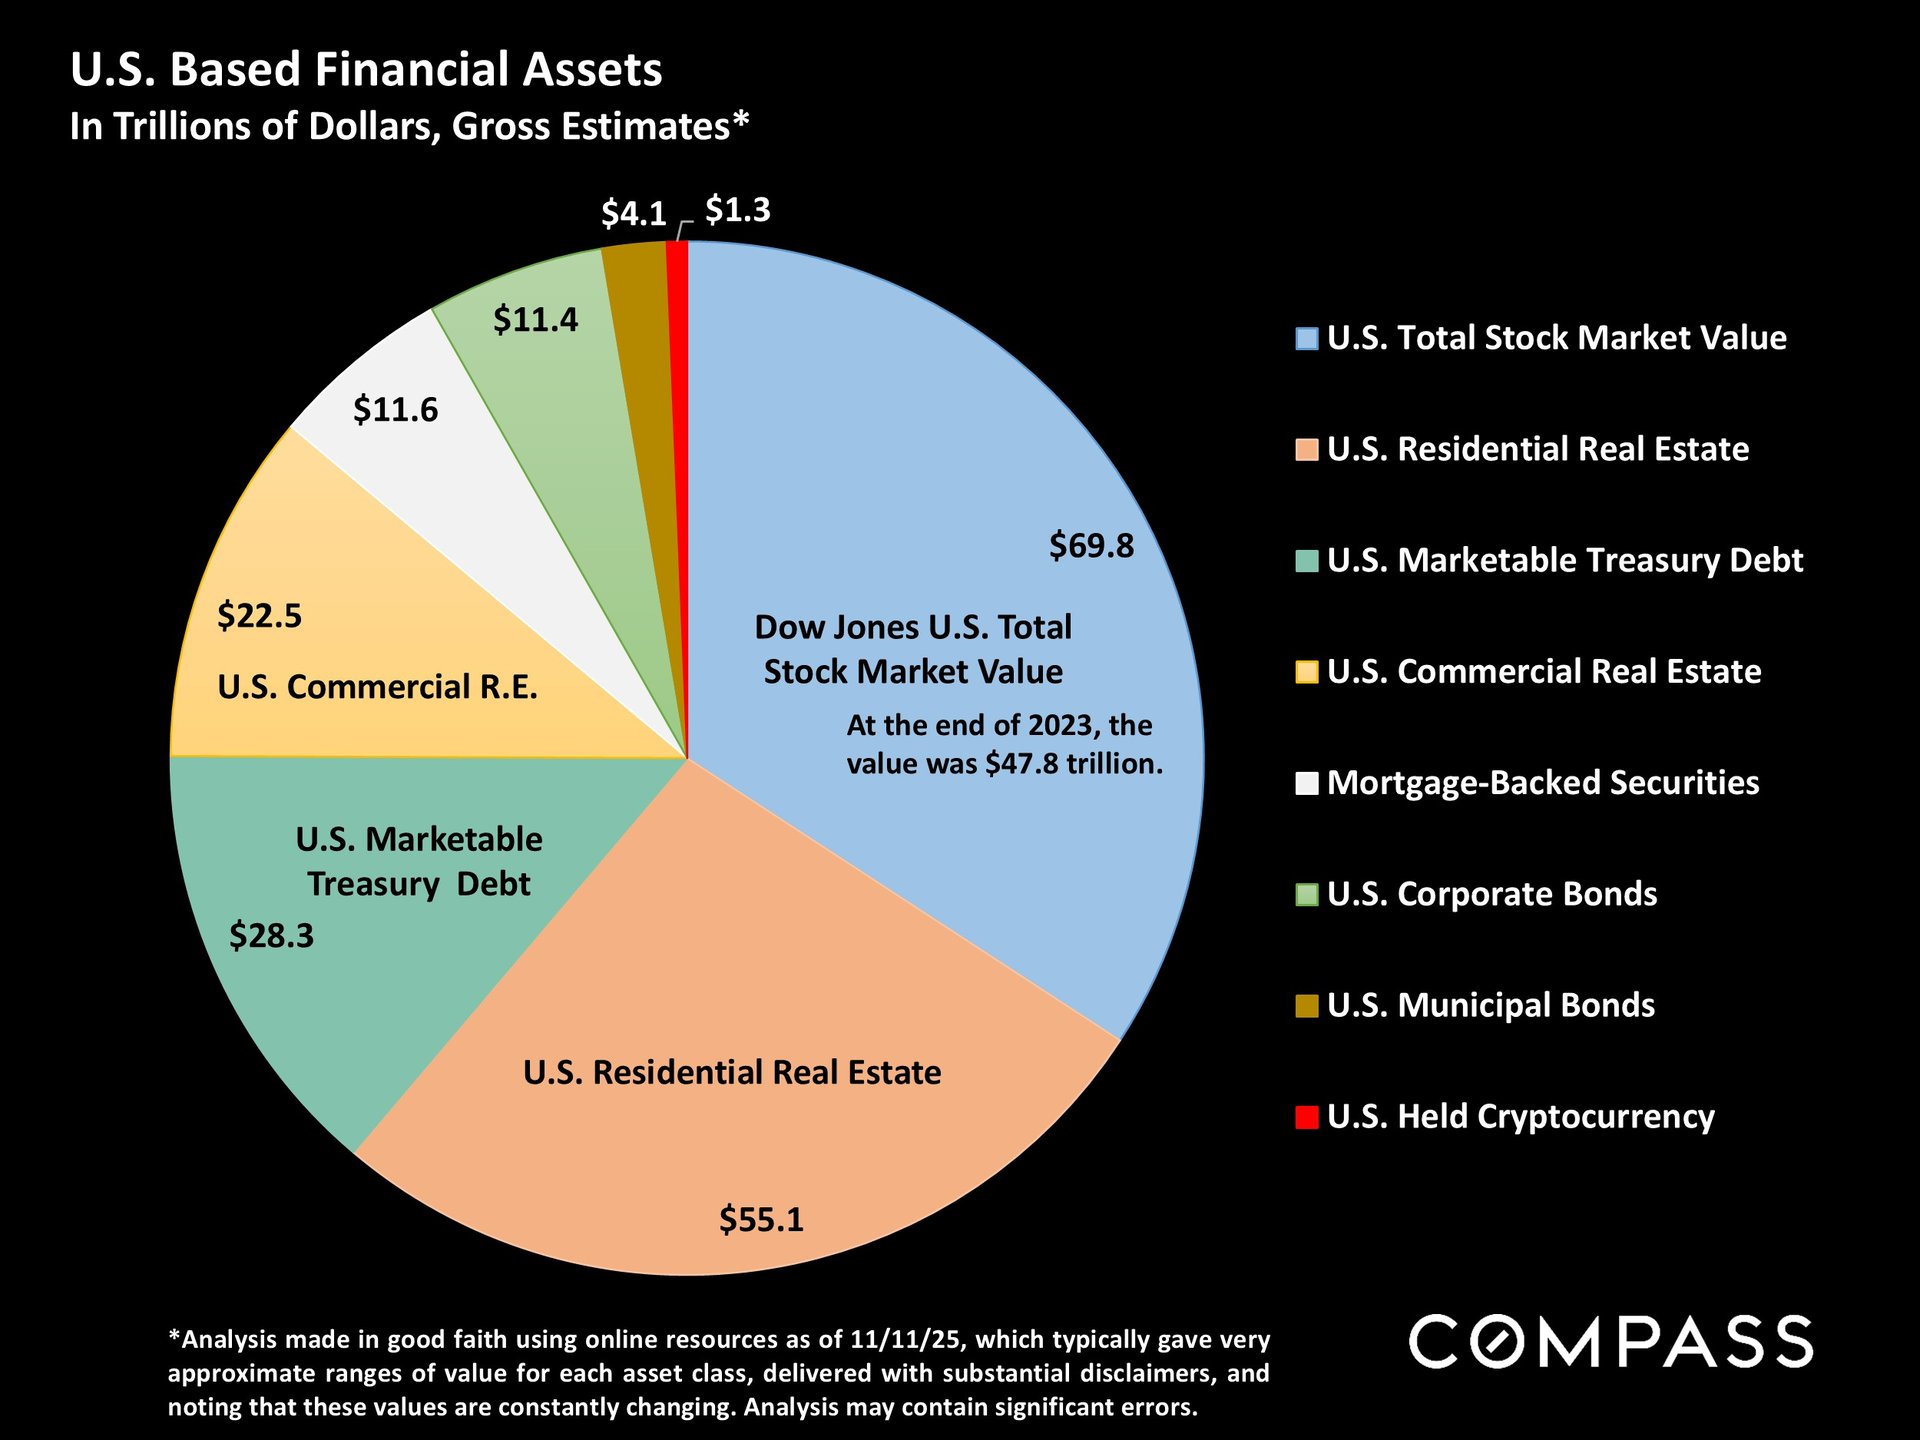
For what it's worth, the analysis below on U.S Financial Assets was generated using Gemini AI.