Weekly newsletter banner with a glowing world map and data charts.

Selected Economic Indicators

Weekly average 30-year fixed rate mortgage: Ticking up slightly in recent weeks. 
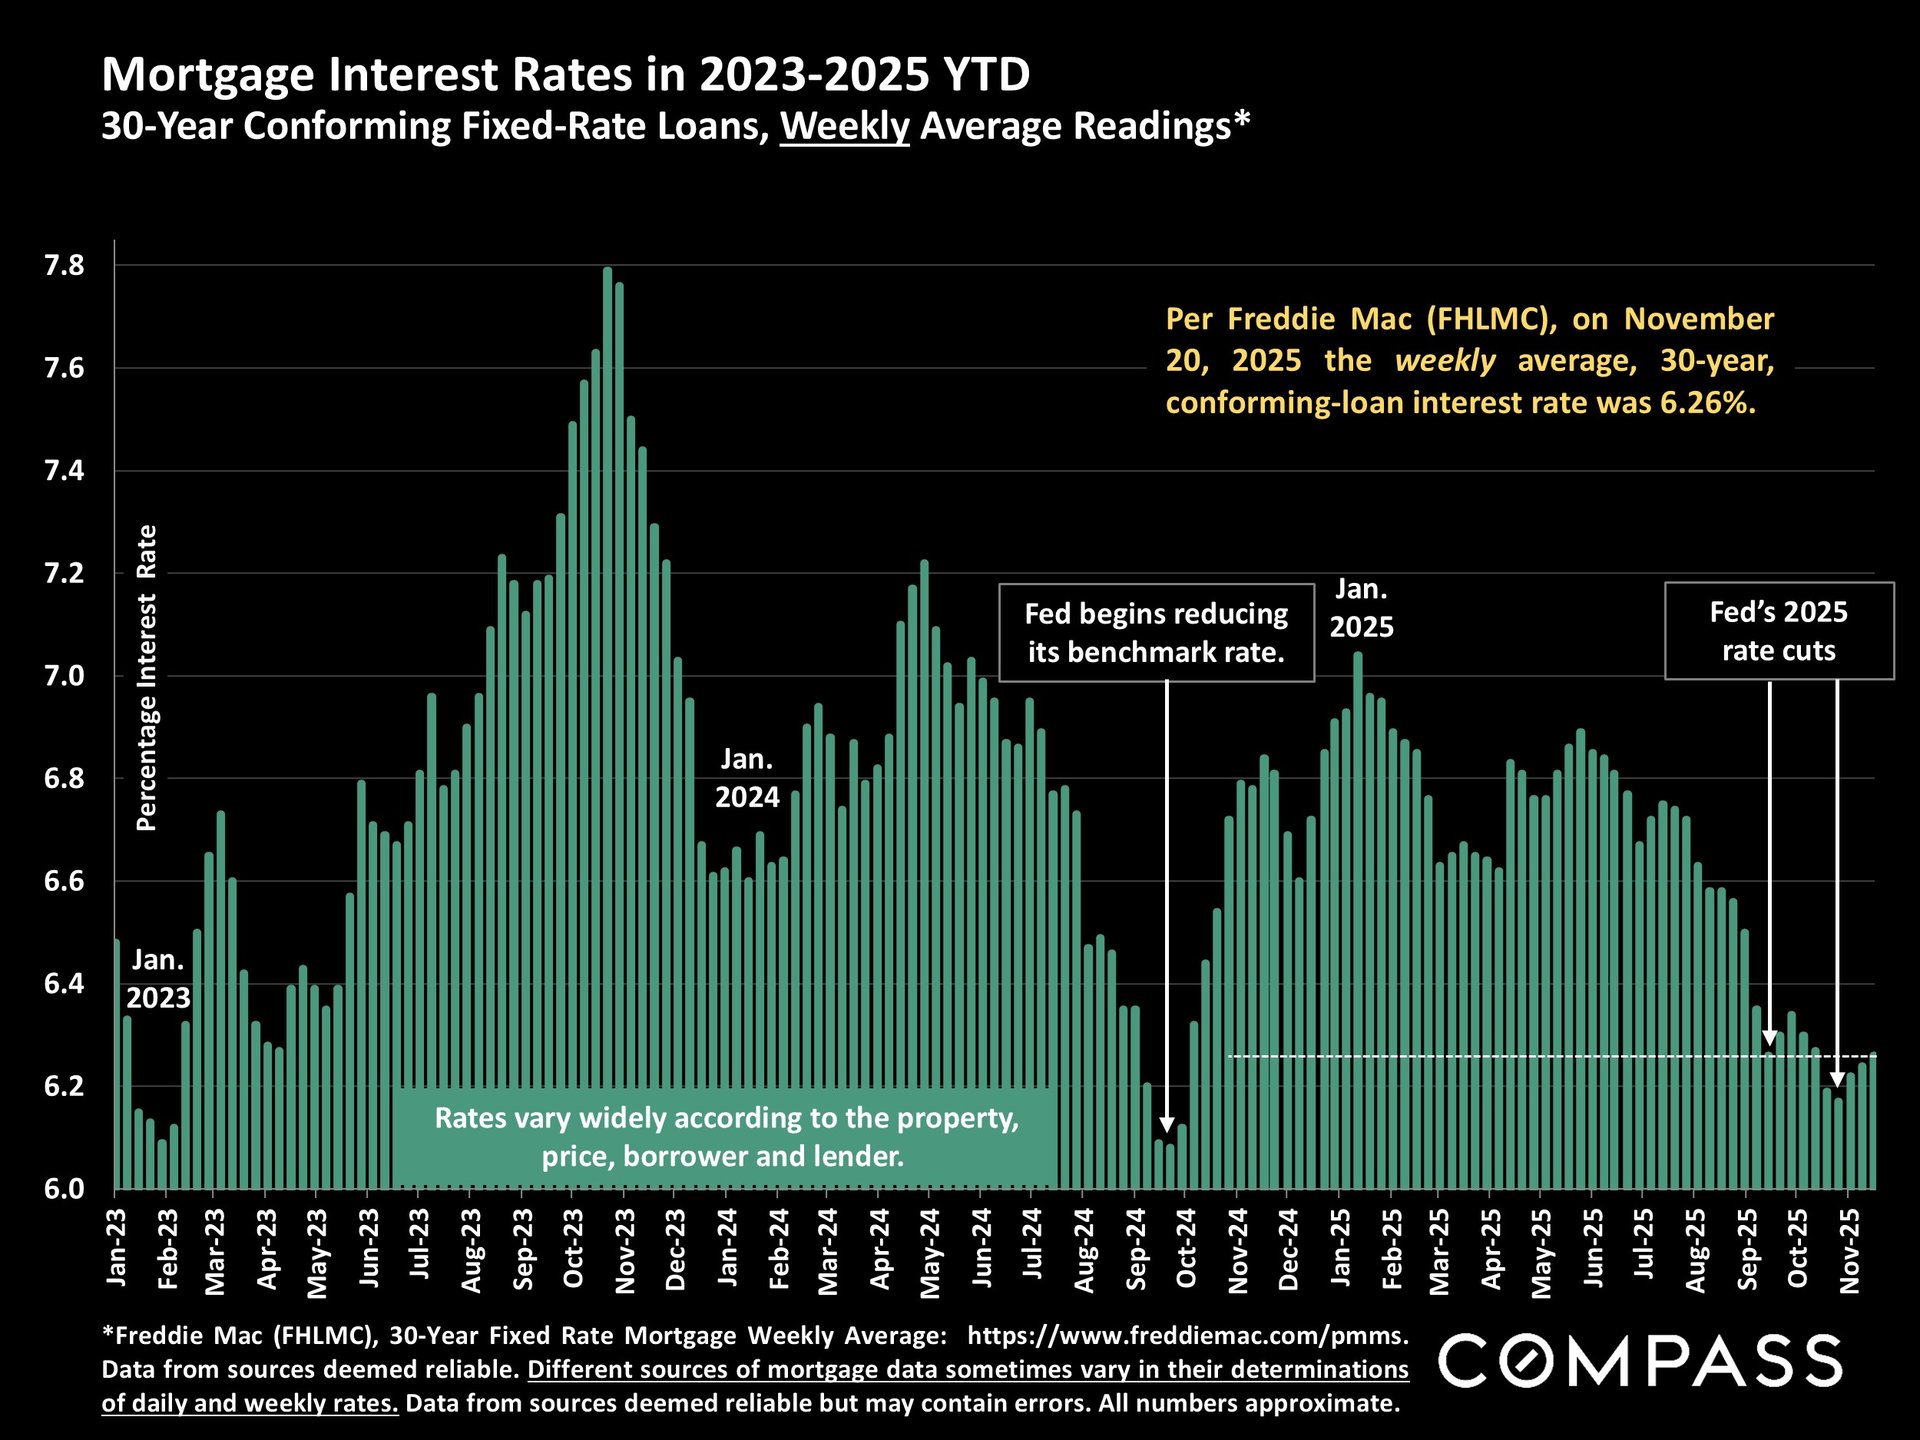
Chart of weekly 30-year mortgage rates from 2023 to November 2025, peaking near 7.8% in late 2023.

Stock markets have had a few volatile weeks due to AI bubble concerns, over which there is vehement disagreement among analysts and industry pundits. As of mid-day today (EST), the S&P and Nasdaq are up about 1% from yesterday. 
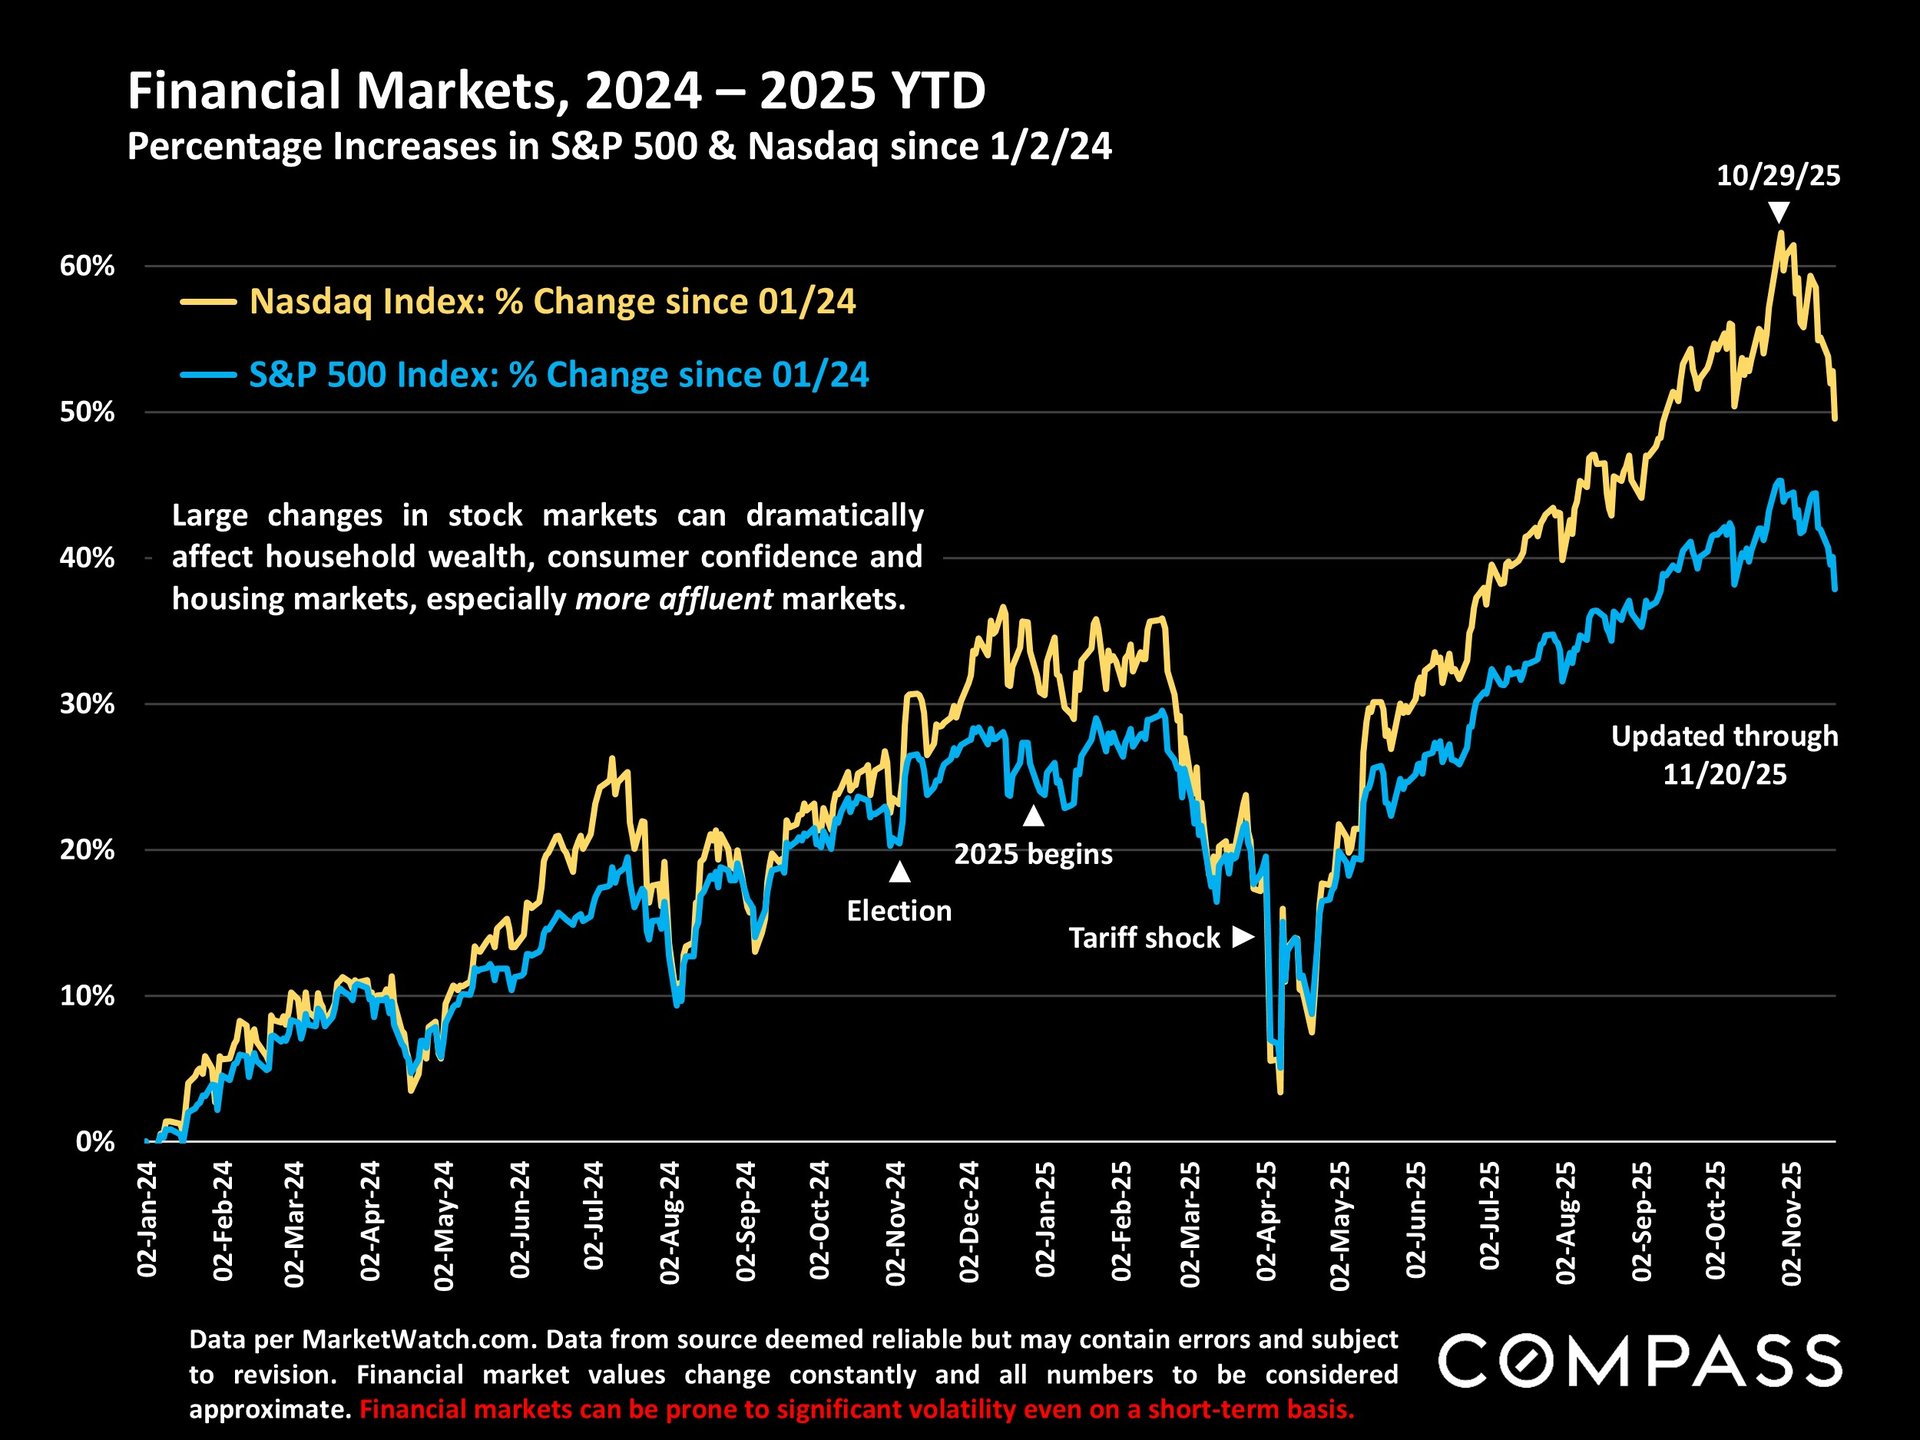
Chart of Nasdaq and S&P 500 gains since January 2024, with a sharp April 2025 tariff-shock decline.

In my last update, I mentioned the "cyclically-adjusted price to earnings (CAPE) ratio" as one respected method of evaluating stock markets. I found the historical data to create the below chart, updated as of 11/1/25. 
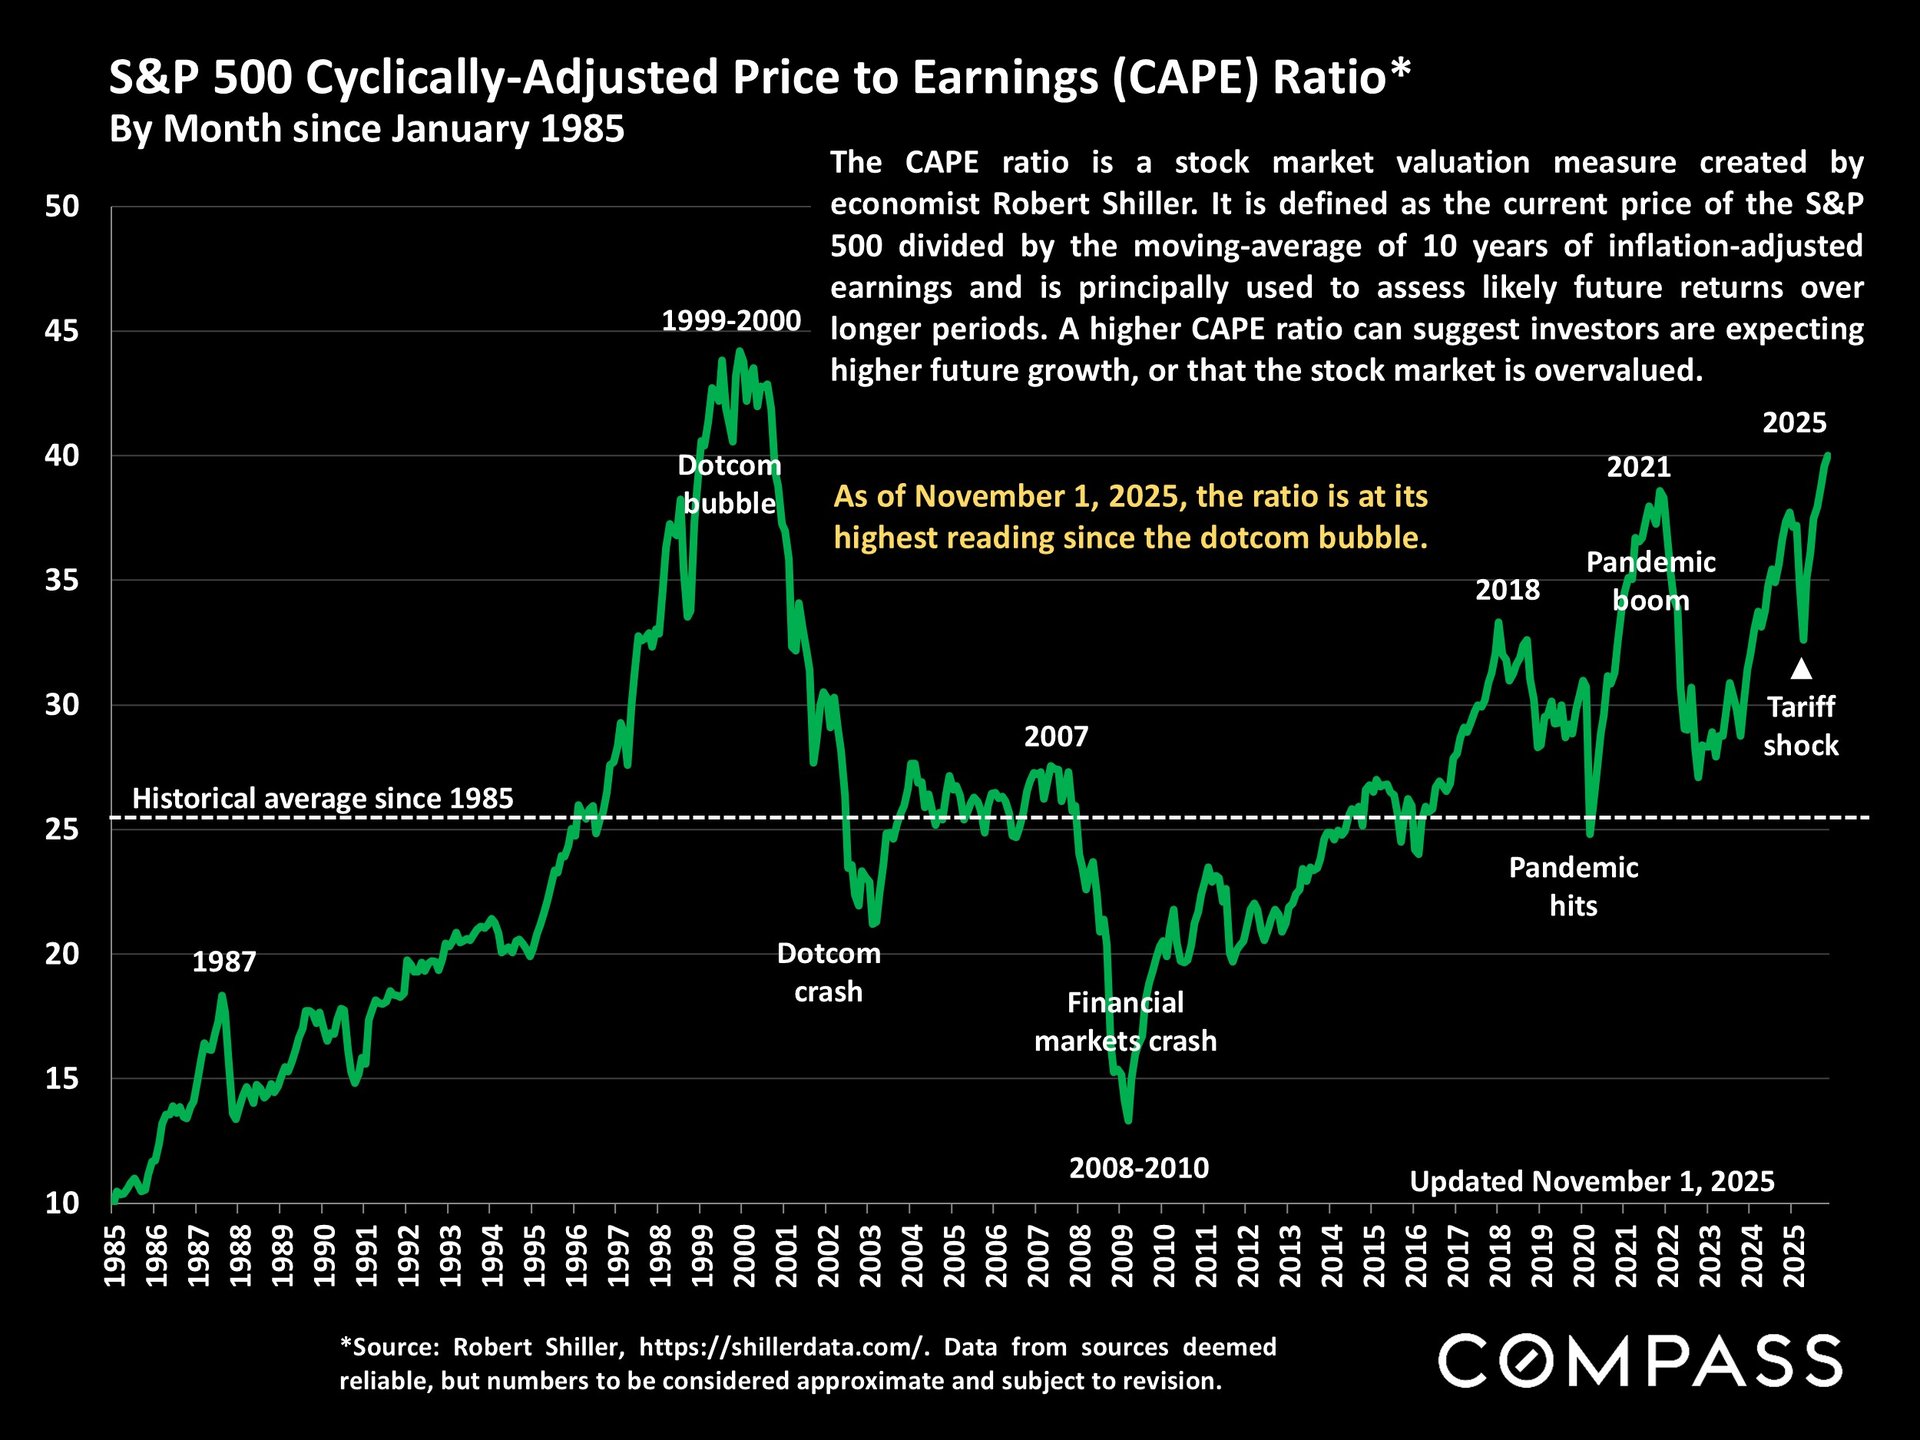
Chart of the S&P 500 CAPE ratio, 1985–2025, with a green trend line and market-event annotations.

The VIX Volatility Index has been rapidly climbing since the month began. 

2025 daily VIX chart showing a sharp spike above 50 in early April after a tariff shock.
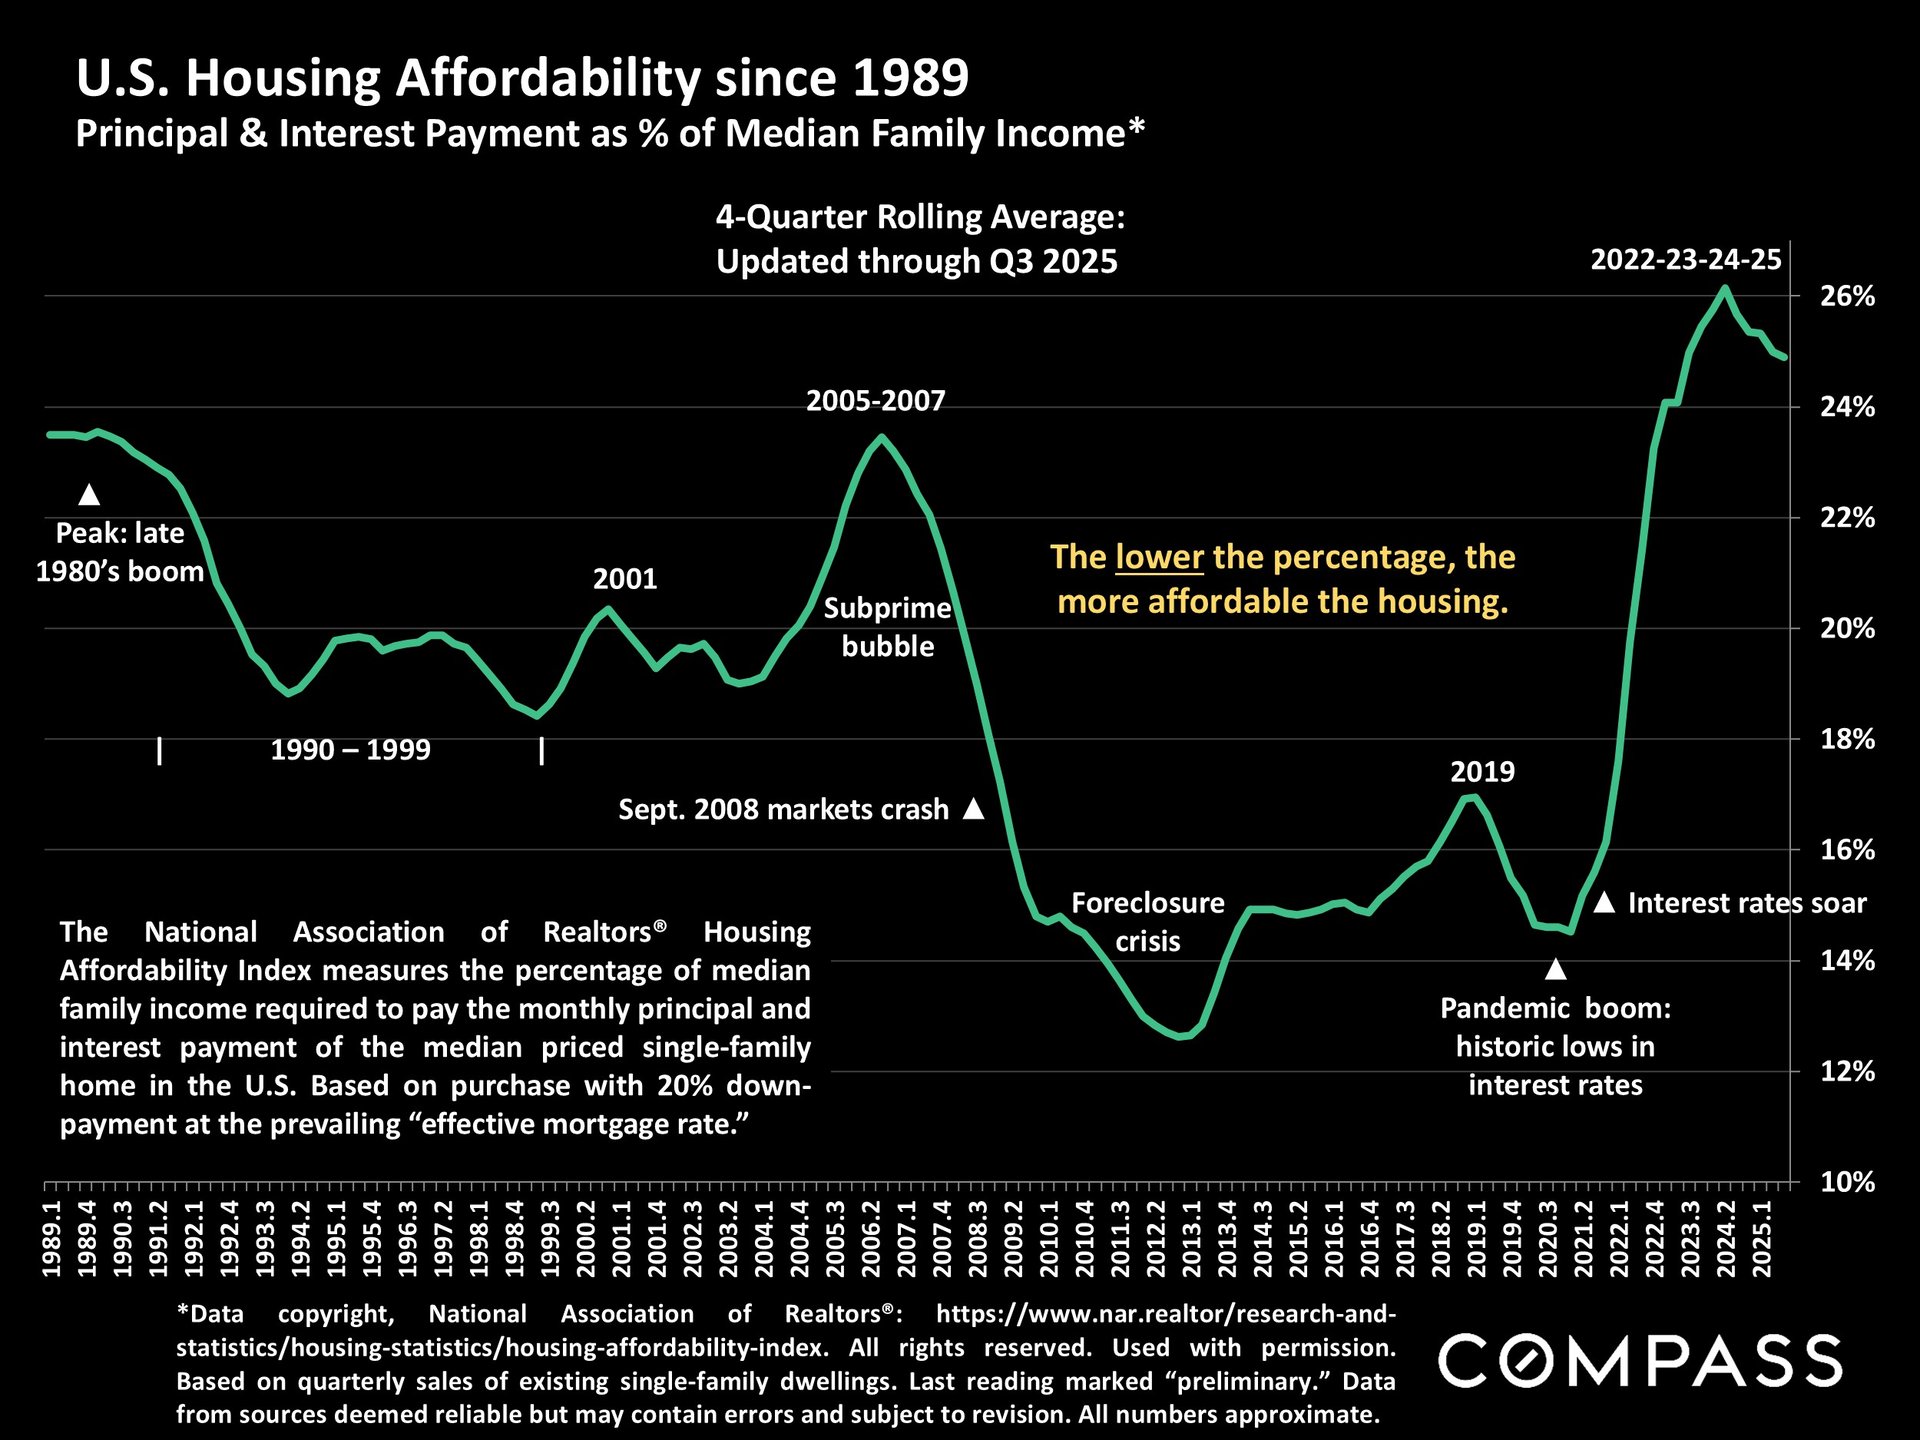
Housing affordability, per NAR calculations for Q3. Higher readings signify lower affordability. With the recent decline in interest rates, affordability has improved. 
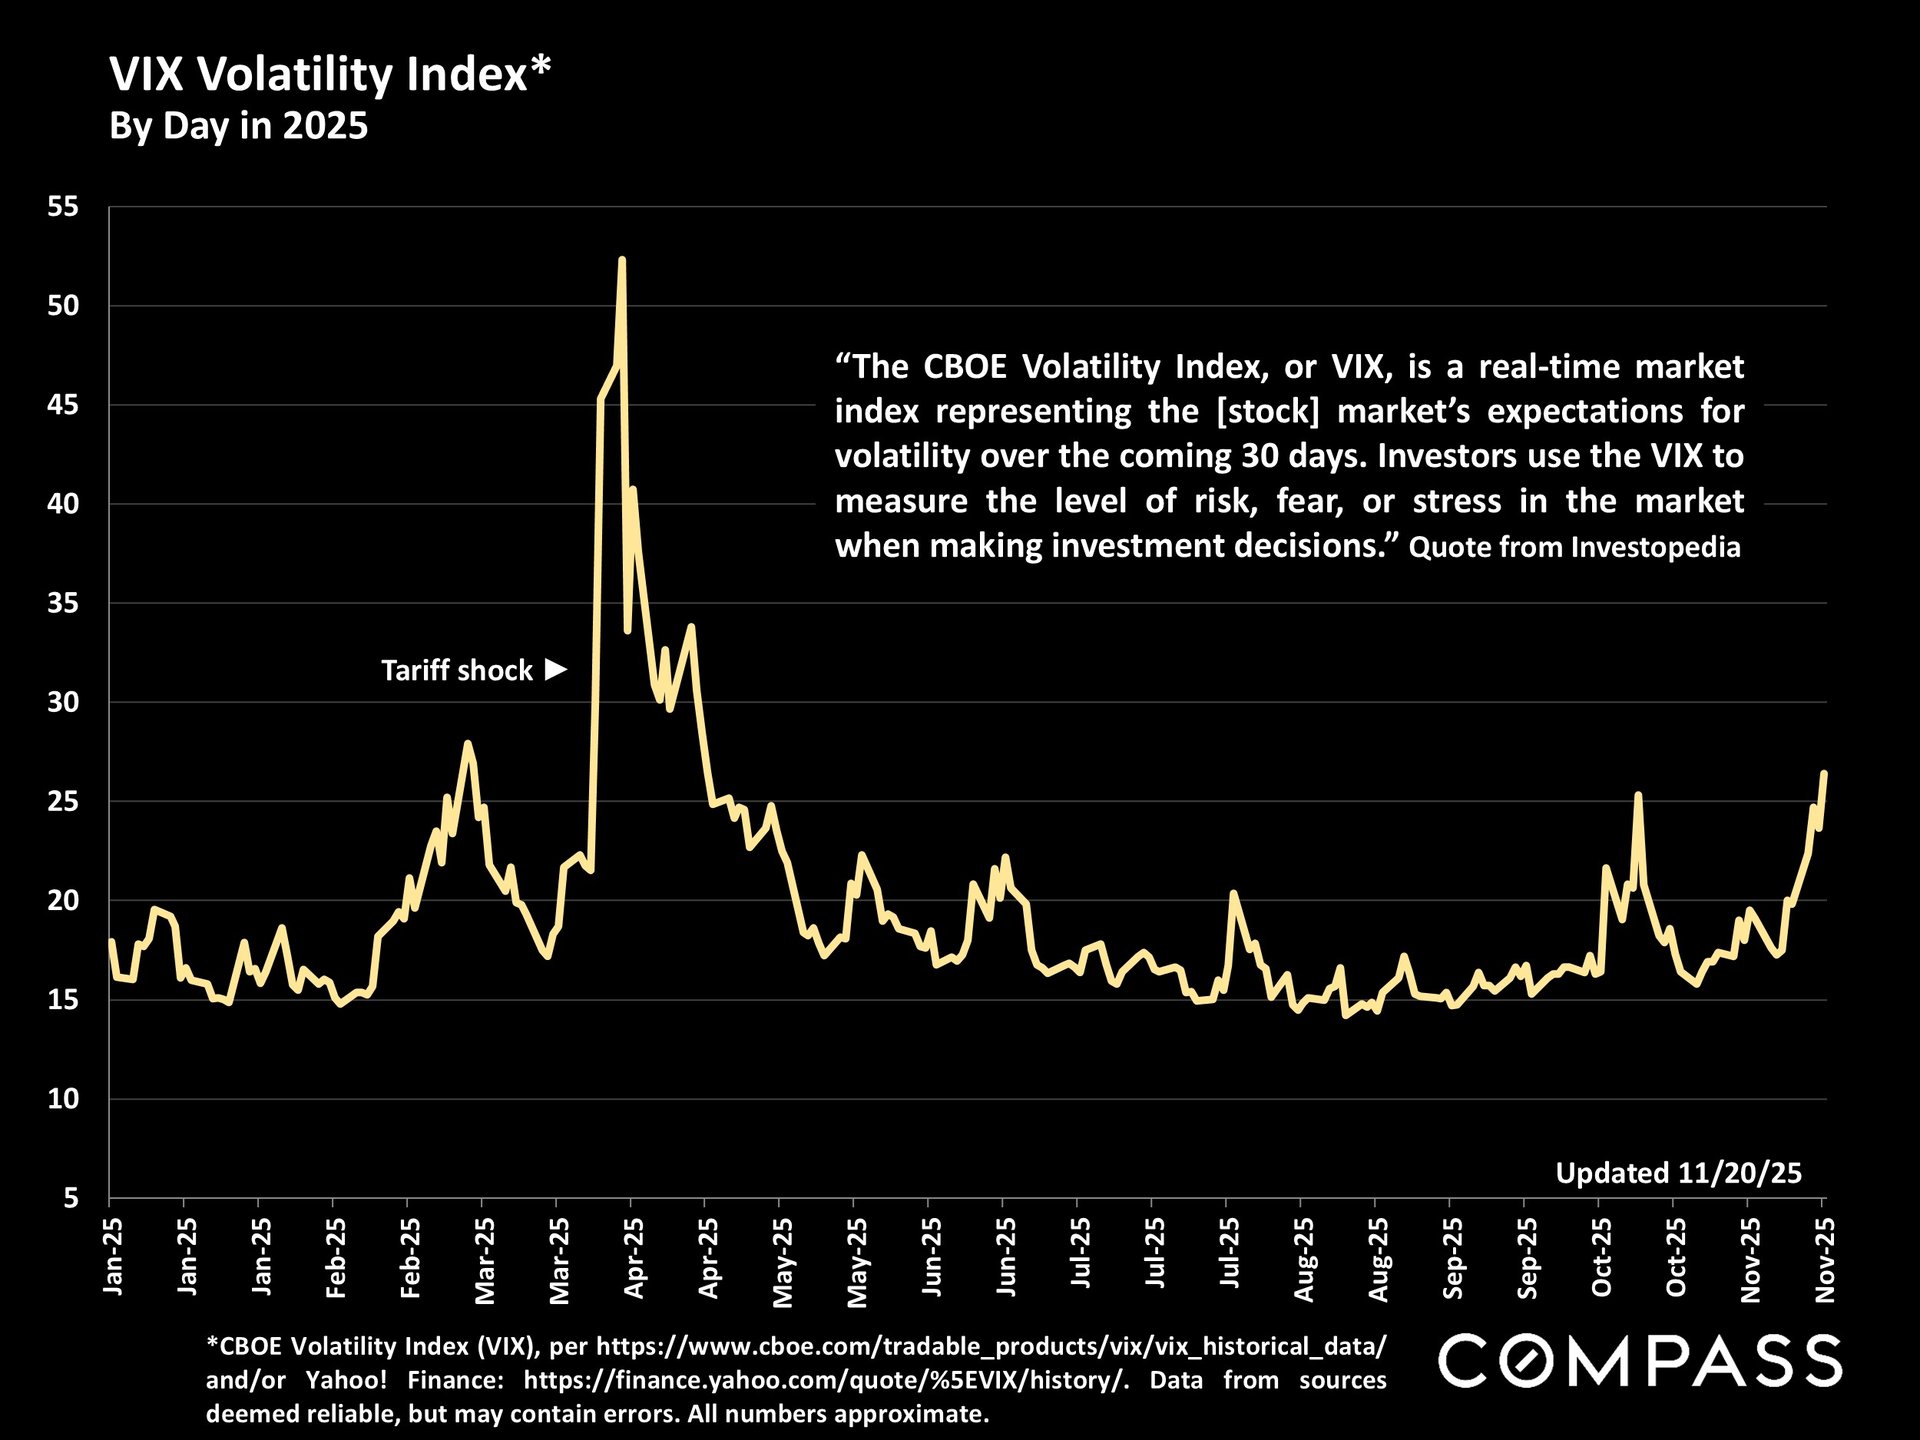
Chart tracking U.S. housing affordability from 1989 through Q3 2025, with a green line and annotated market events.

A new jobs report through September was just released. As mentioned in the past, the latest numbers are often revised so substantially in subsequent months that I don't know why economists, investors and analysts consider them reliable. 
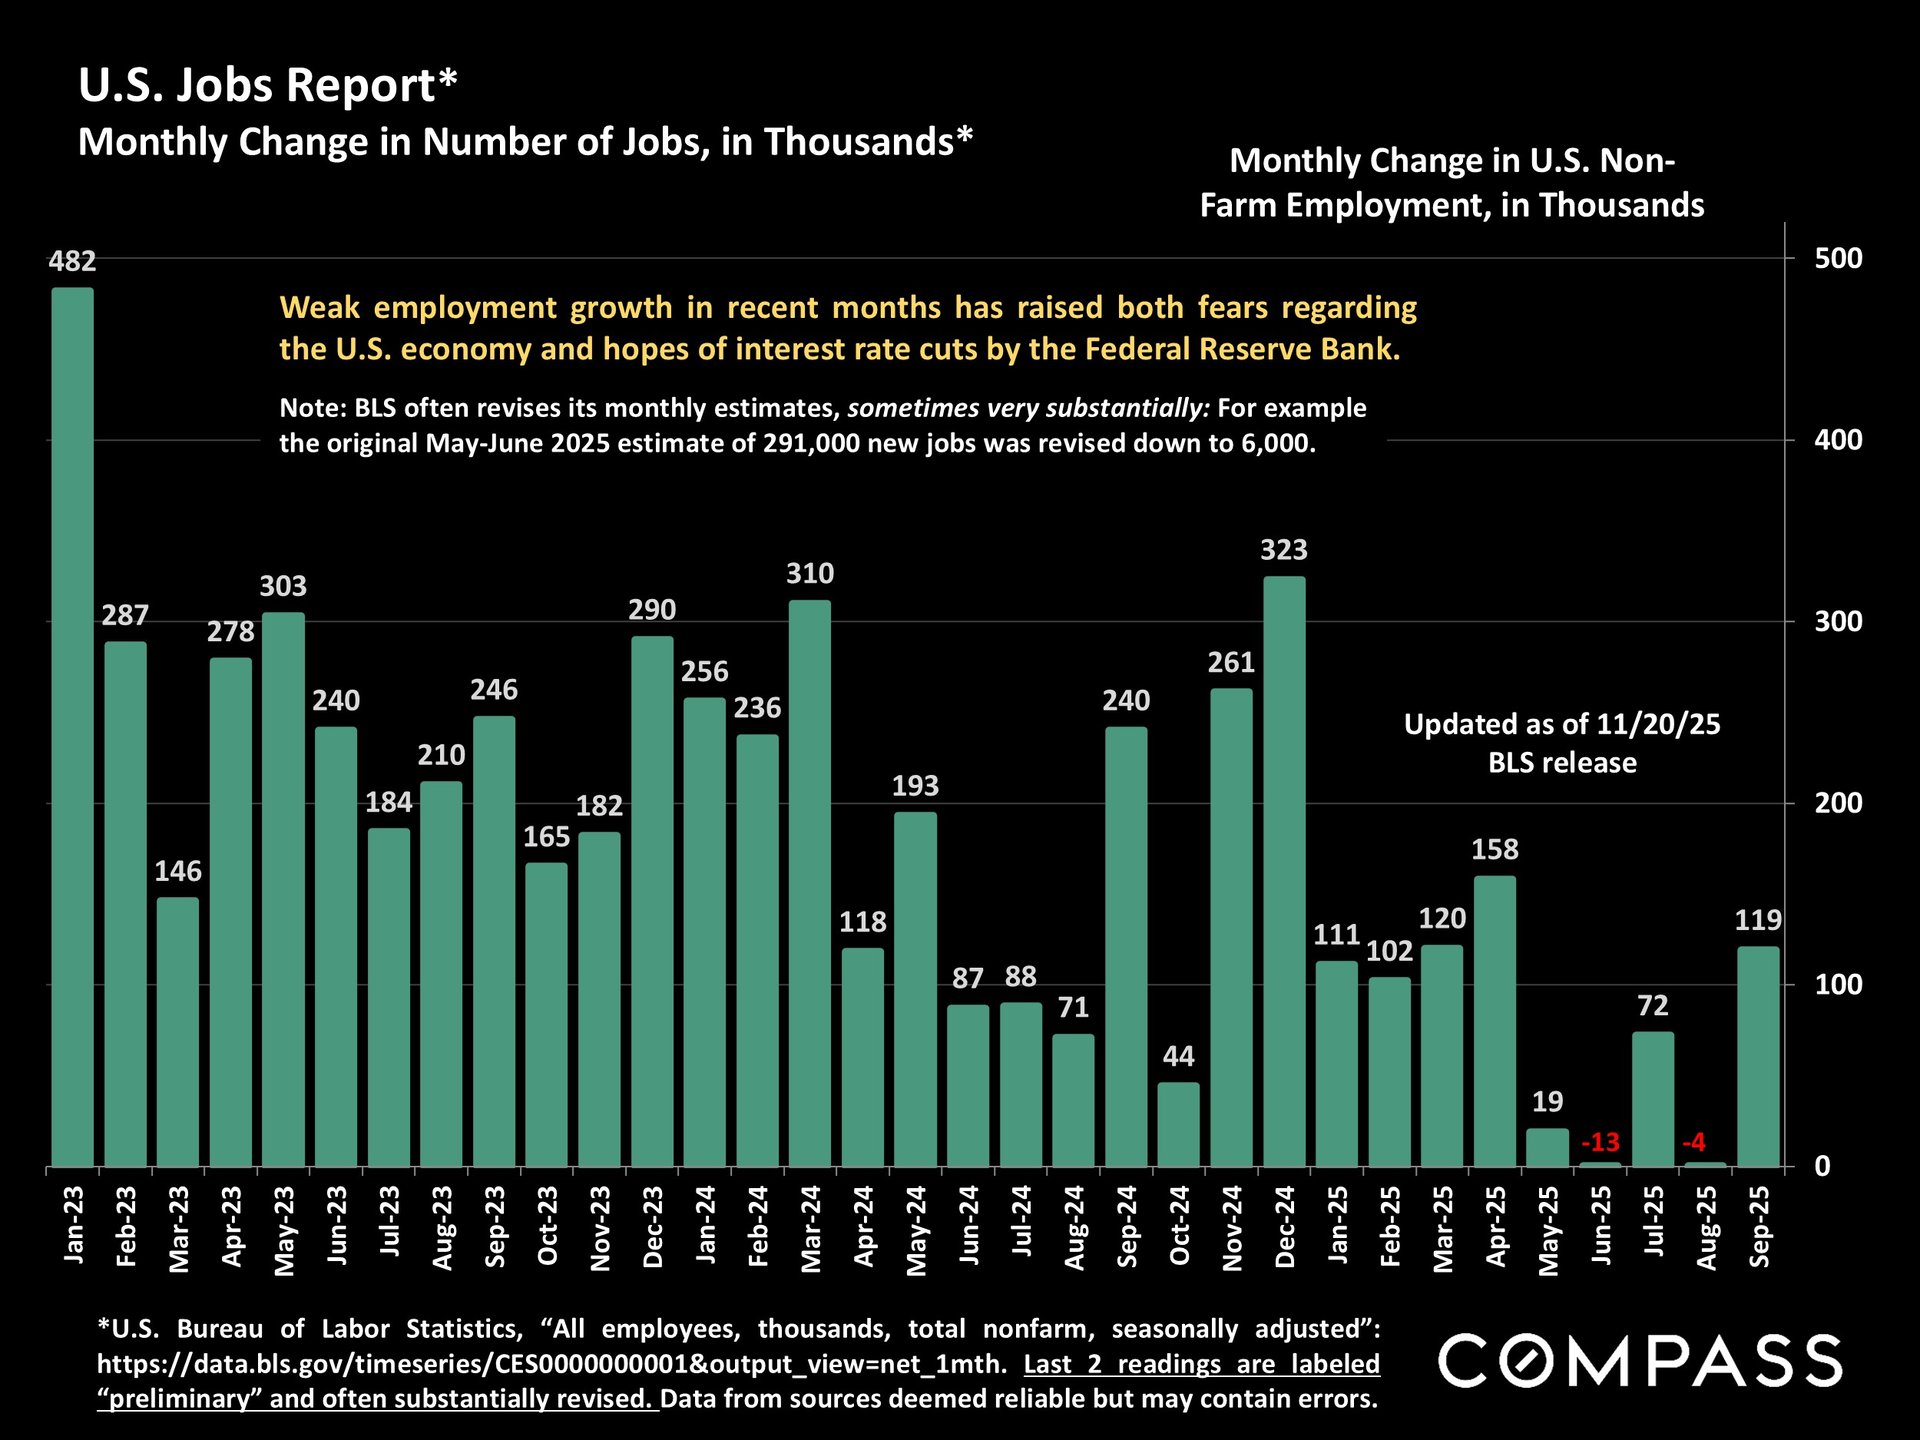
Bar chart of monthly U.S. nonfarm job changes from January 2023 to September 2025, with recent weak growth and revisions noted.

Unemployment has been ticking up. It is now up to its highest reading since 2021, though not high by long-term standards. 
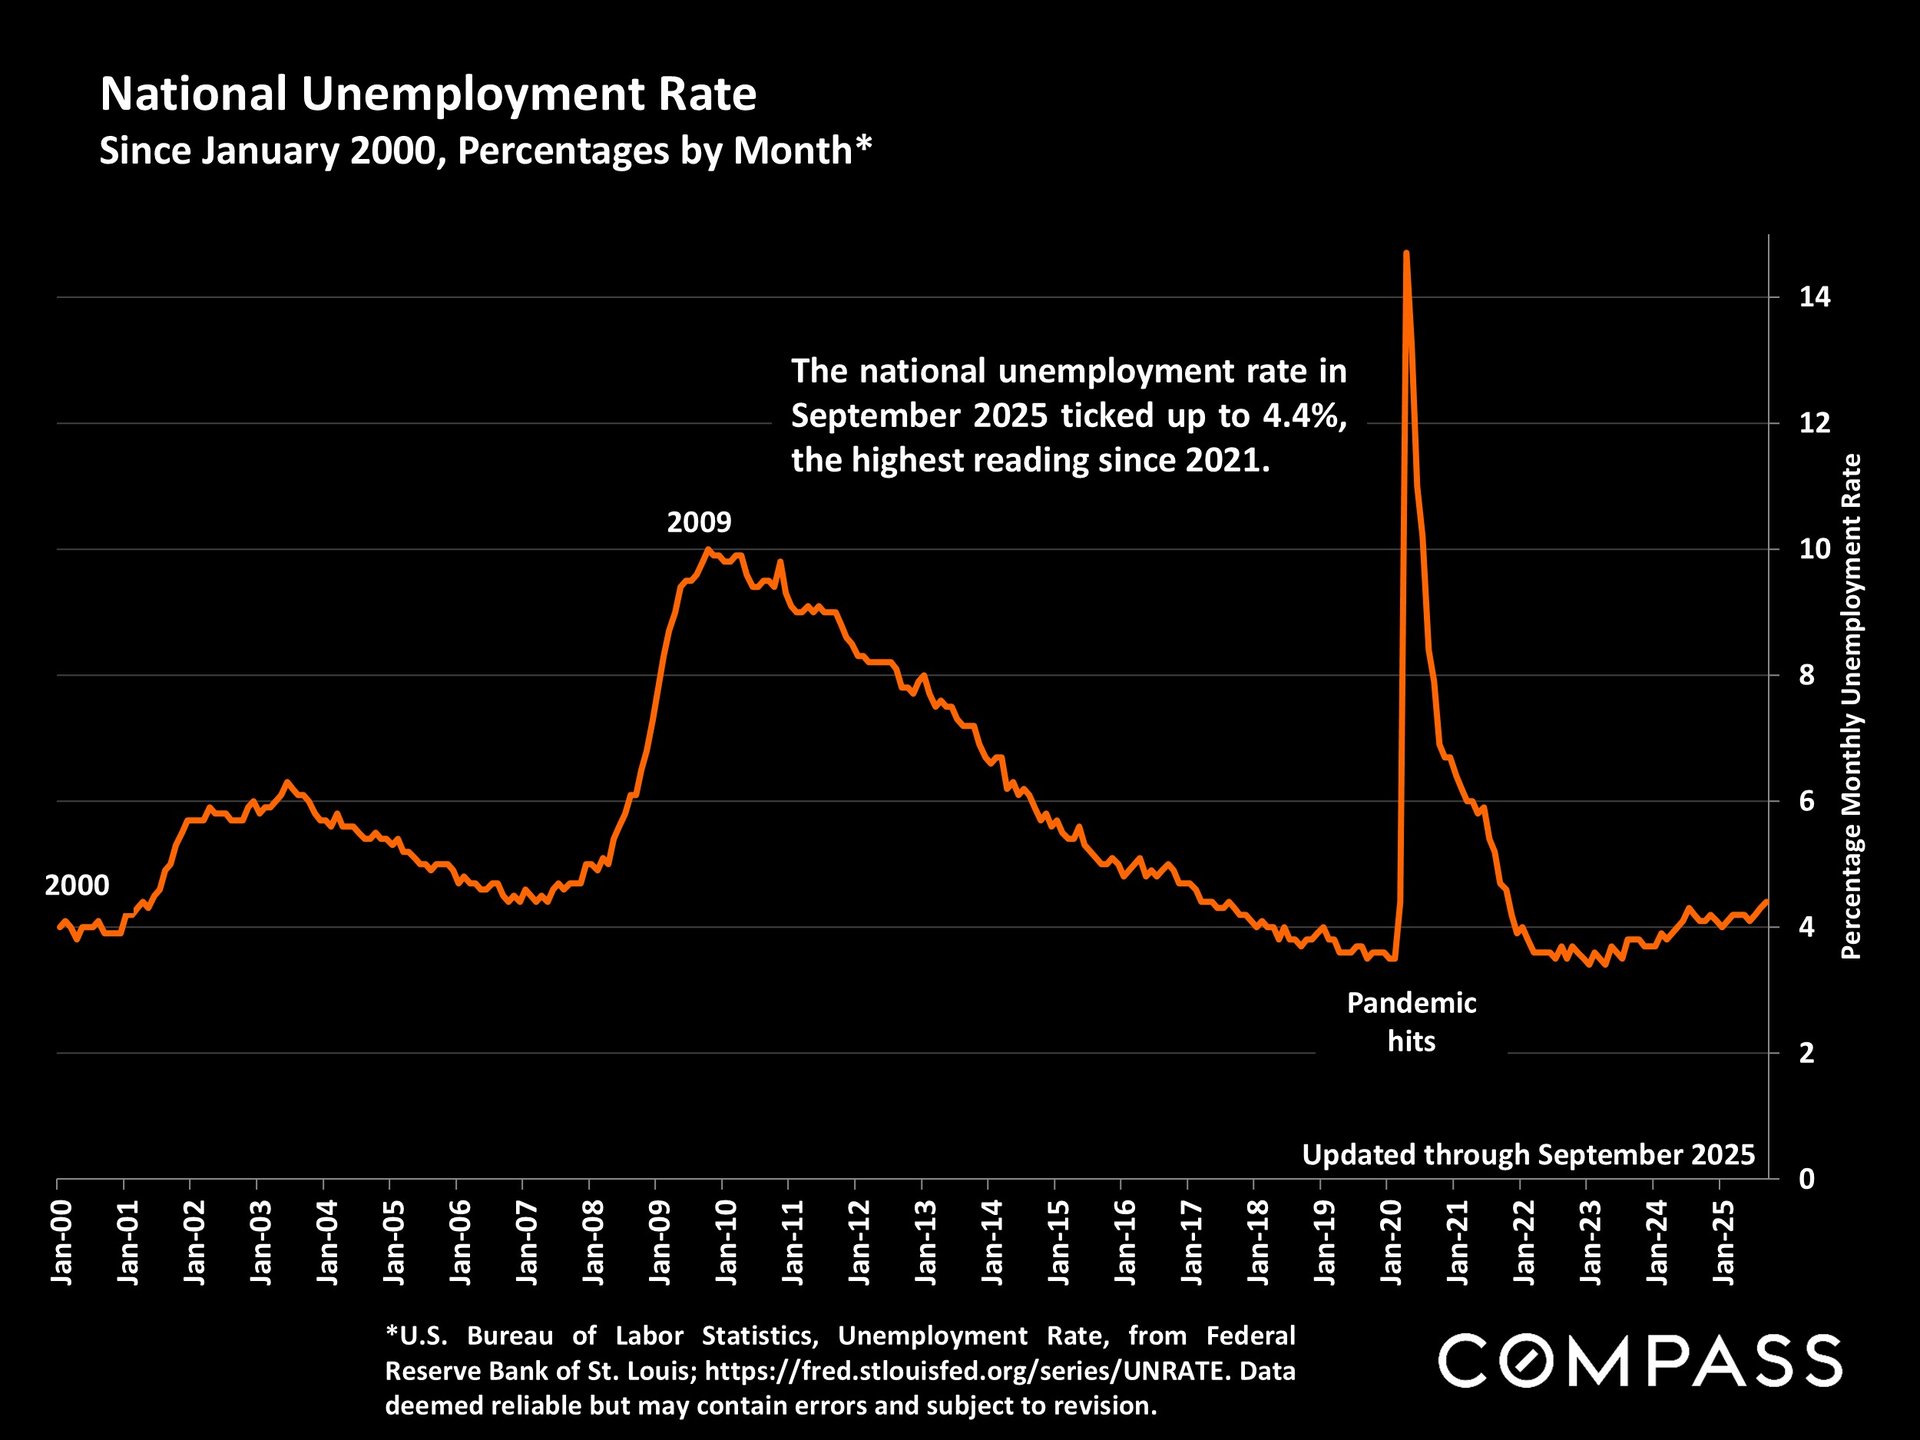
Chart of U.S. unemployment rates from 2000 to 2025, with a 2009 rise and a sharp pandemic spike.

The price of bitcoin has been crashing (but has often seen extreme volatility over the years). 
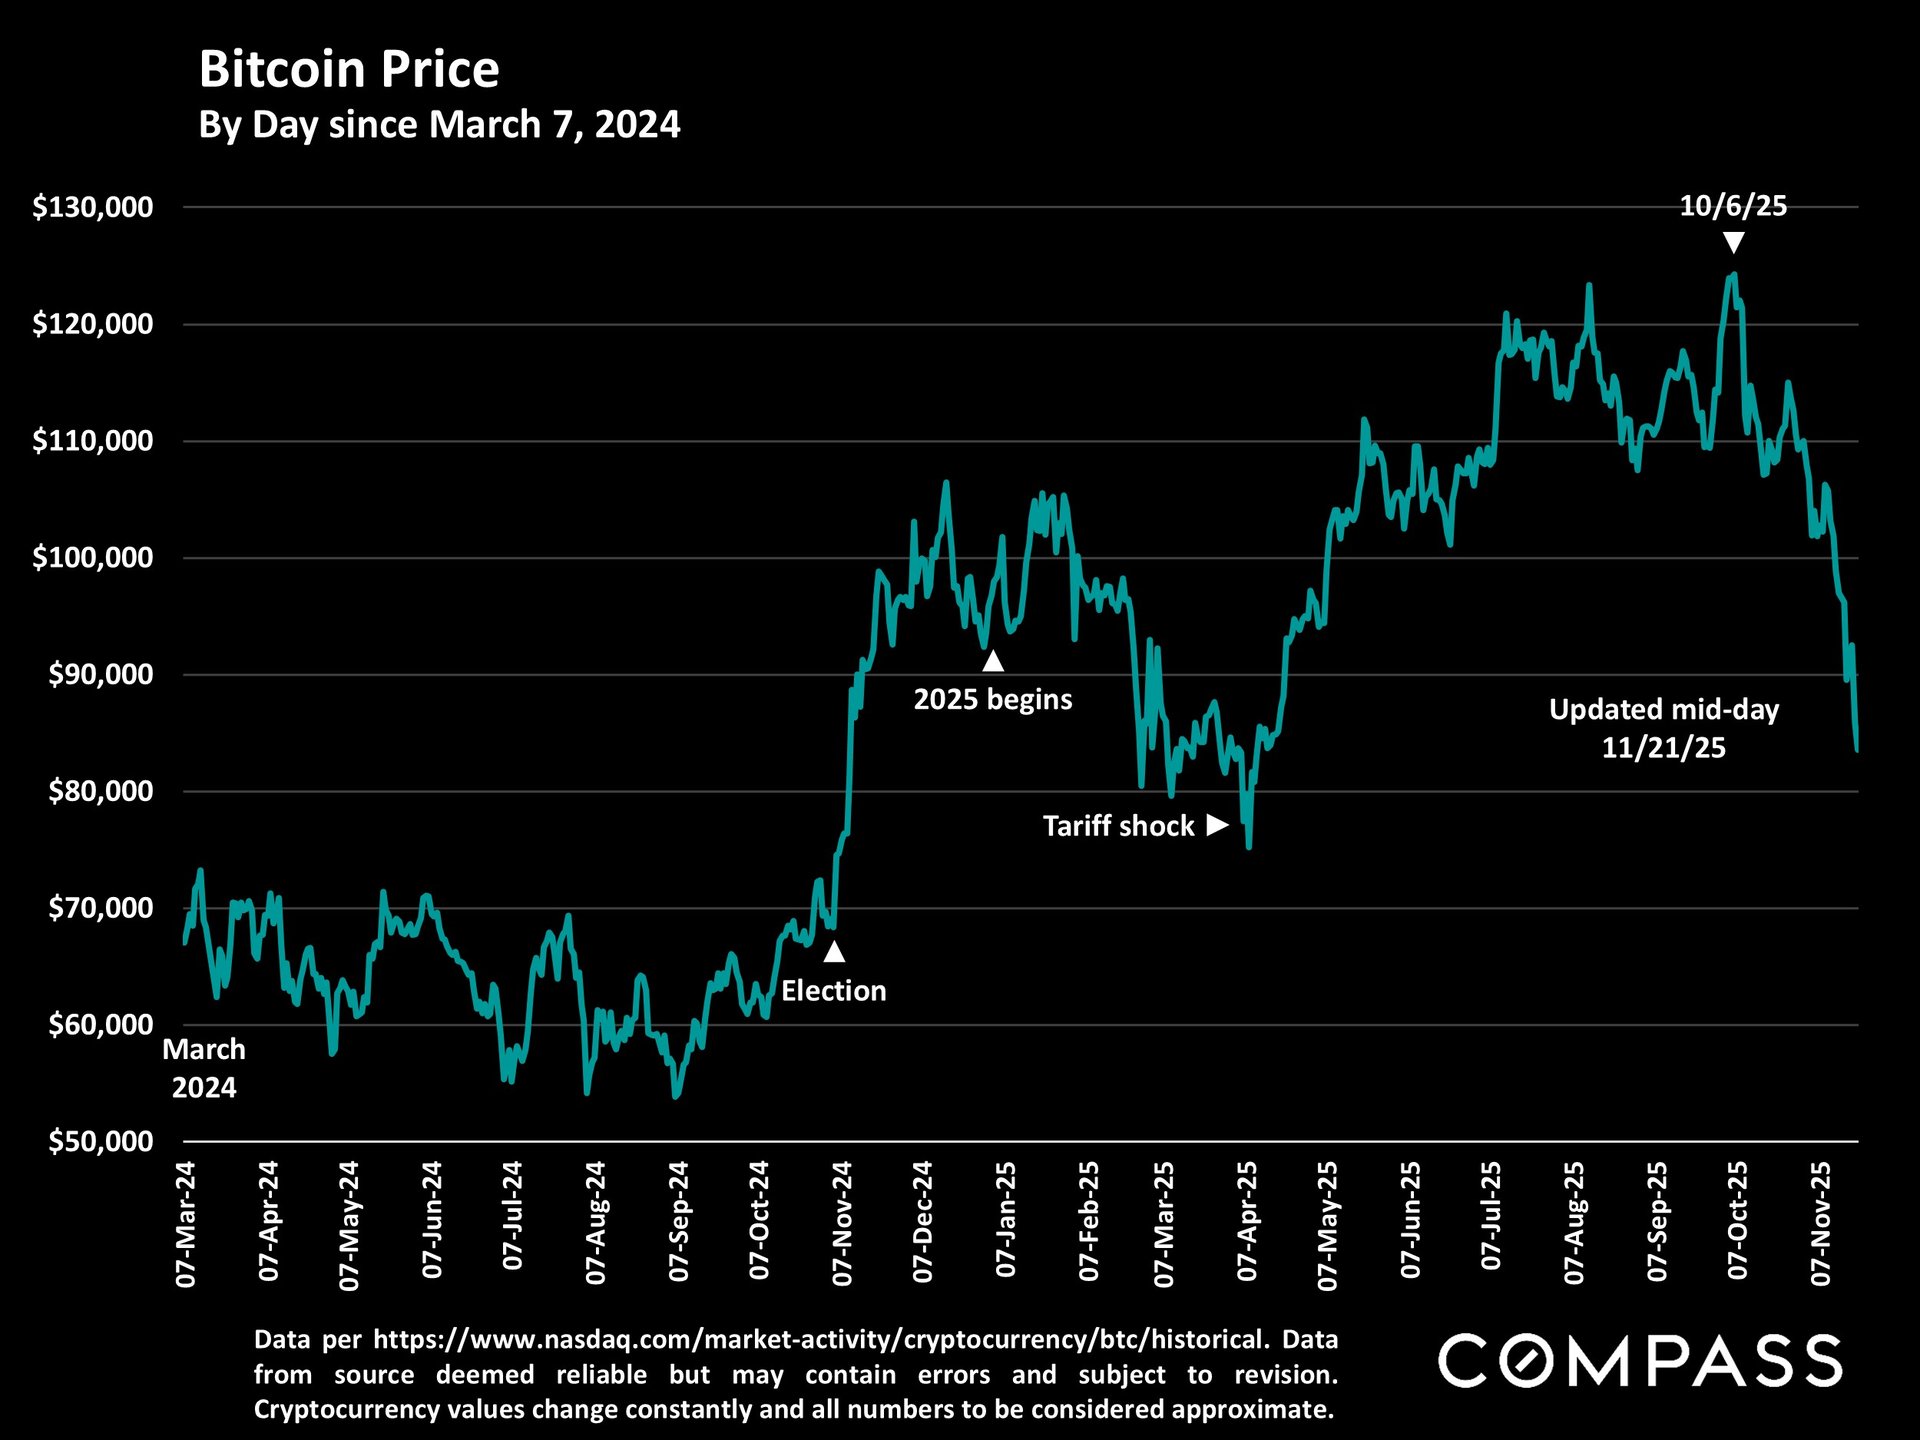
Bitcoin price chart from March 2024 to November 2025, annotated with election, 2025 beginning, and tariff shock.

Consumer Sentiment as measured by the University of Michigan Consumer Surveys remains near a 45-year low, due to substantial concerns about prices, personal finances, inflation, and, increasingly, job security. 

The price of oil: With concerns regarding the slowdown of the global economy, it has been declining - moving in a contrary direction to inflation - of which the latest reading was 3%.
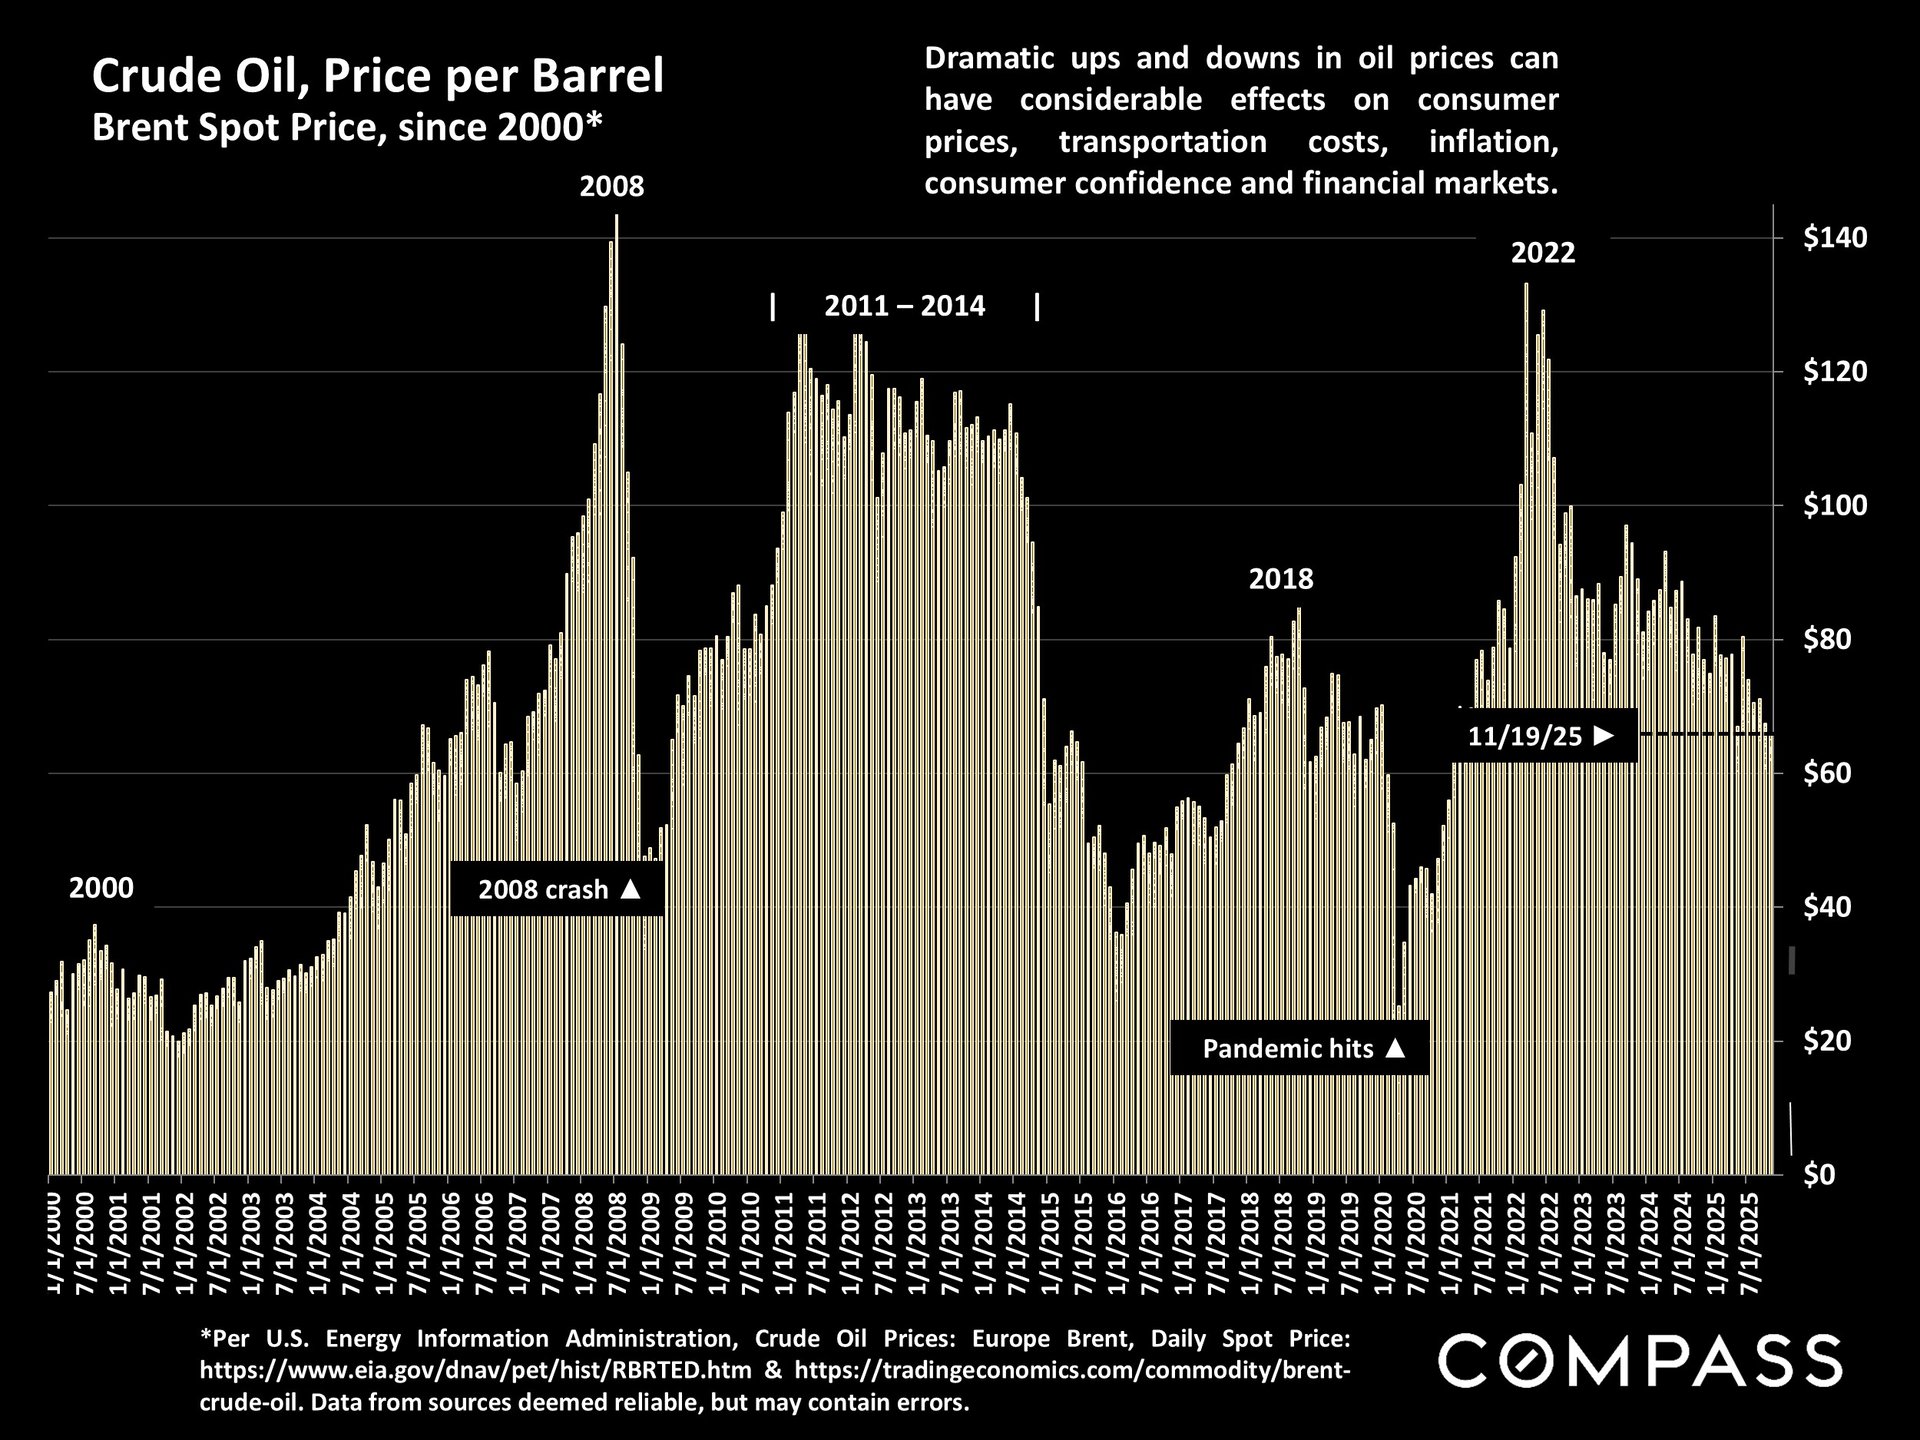

Brent crude oil price chart, 2000–2025, showing major spikes in 2008 and 2022 and a pandemic-era decline.

Work With Nasi and Soulmaz

We understand that Selling or buying a property is undoubtedly one of the most complex financial and emotional decisions anyone can make. A home holds immense value as both an investment and a place to nurture your family and build lasting security.As a dedicated realtor in the Bay Area, we are committed to delivering a personalized approach to every one of our clients. Understanding your unique goals, desires, and timelines is paramount to us, ensuring an exceptional experience tailored precisely to your needs.Equipped with a data-driven mindsets, we provide you with the necessary information to make the most well-informed decisions possible. The East Bay market is highly competitive, demanding an innovative and tech-savvy approach to stay ahead. We eagerly await the opportunity to collaborate with you and assist in achieving your real estate aspirations.

Follow Me on Instagram