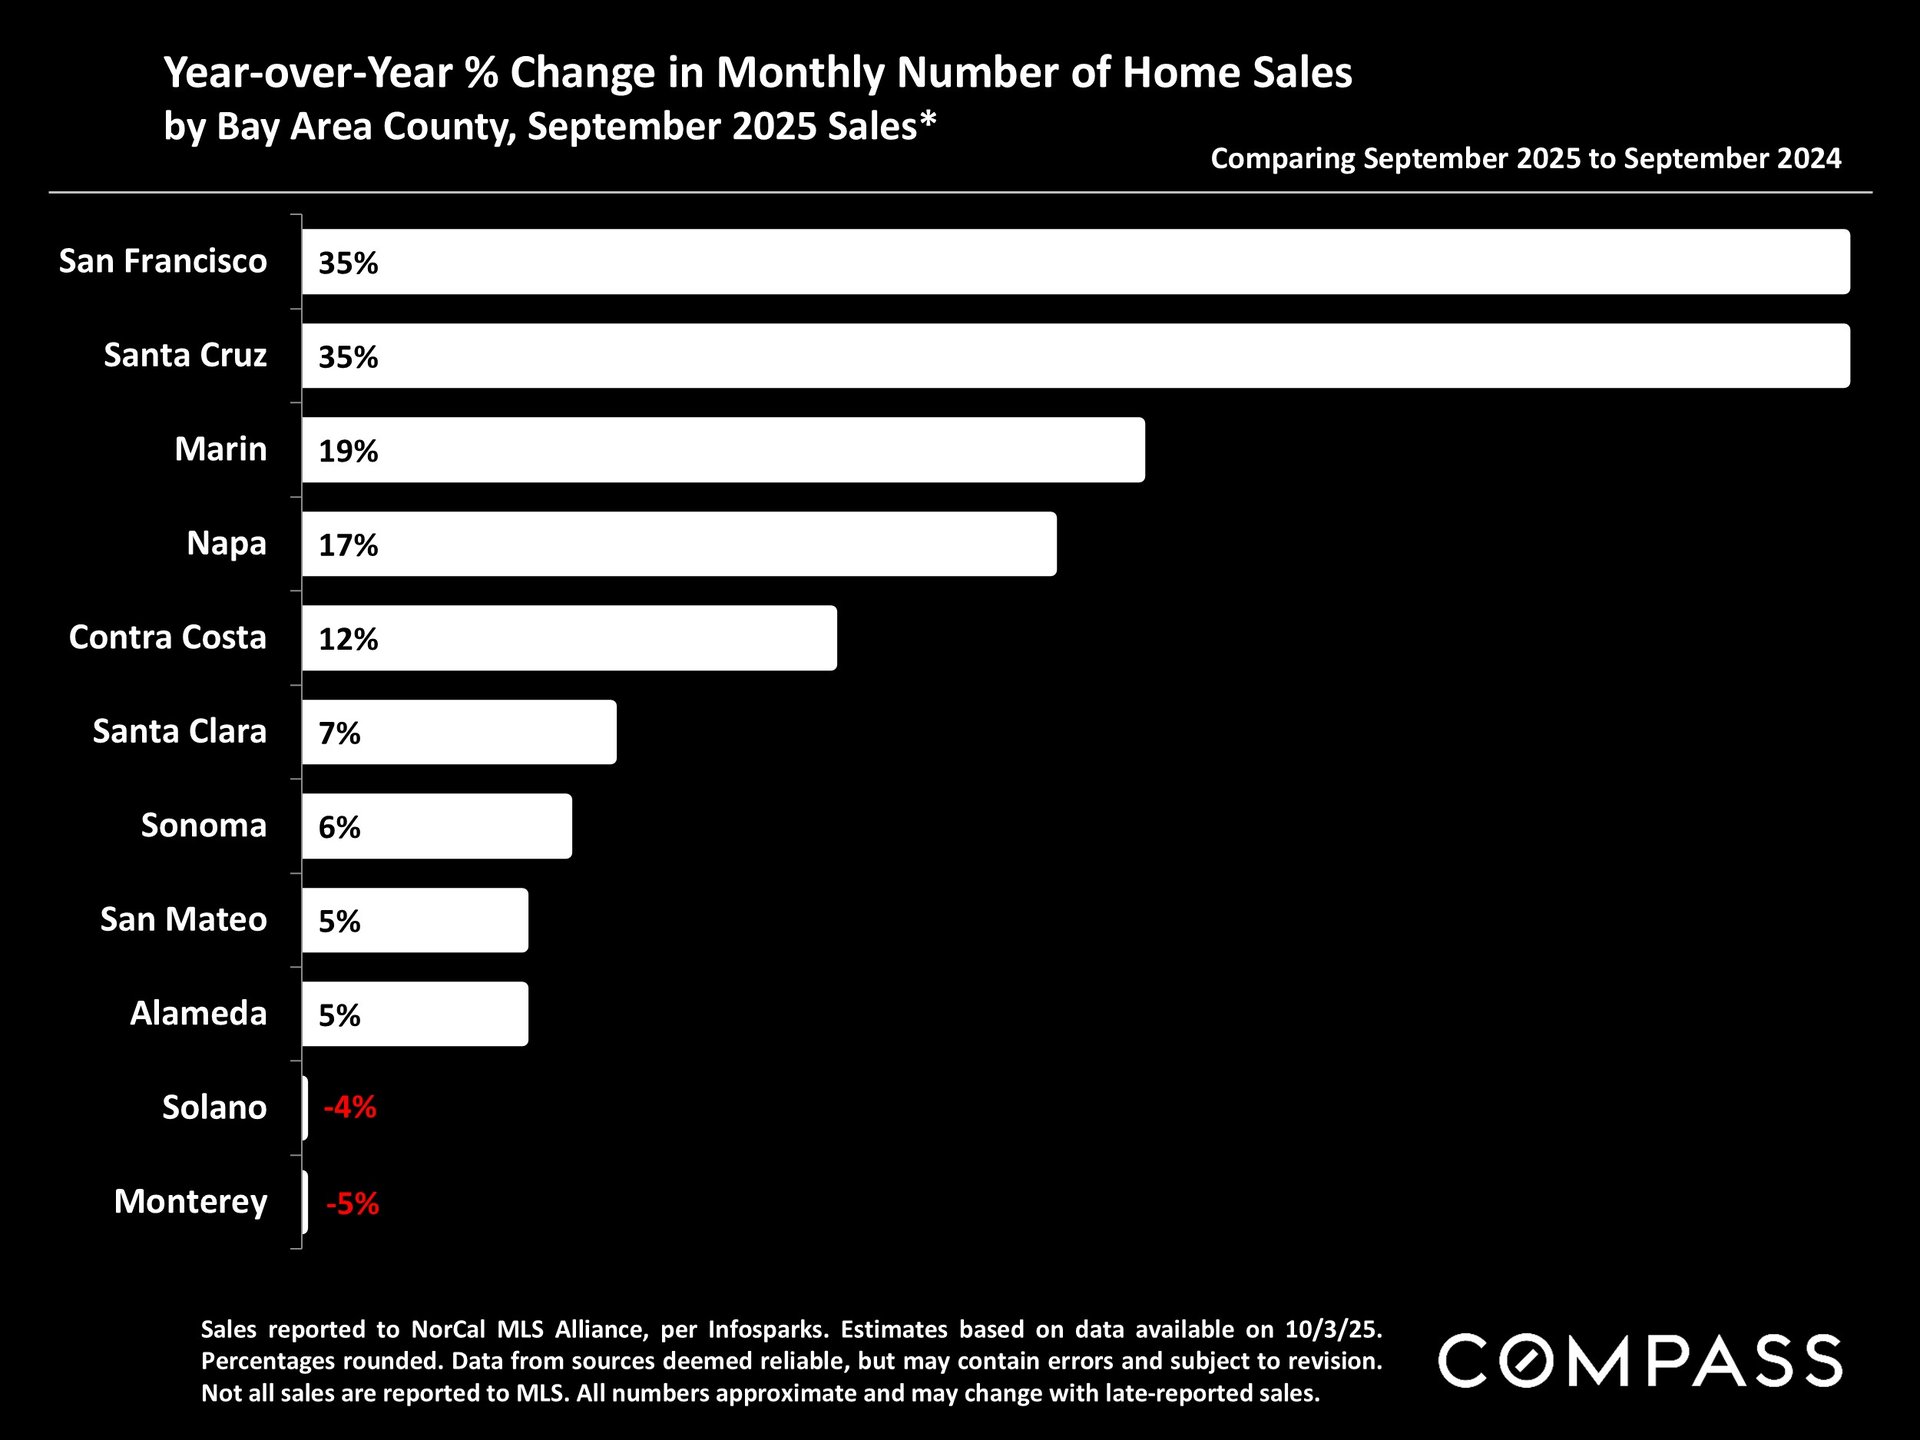
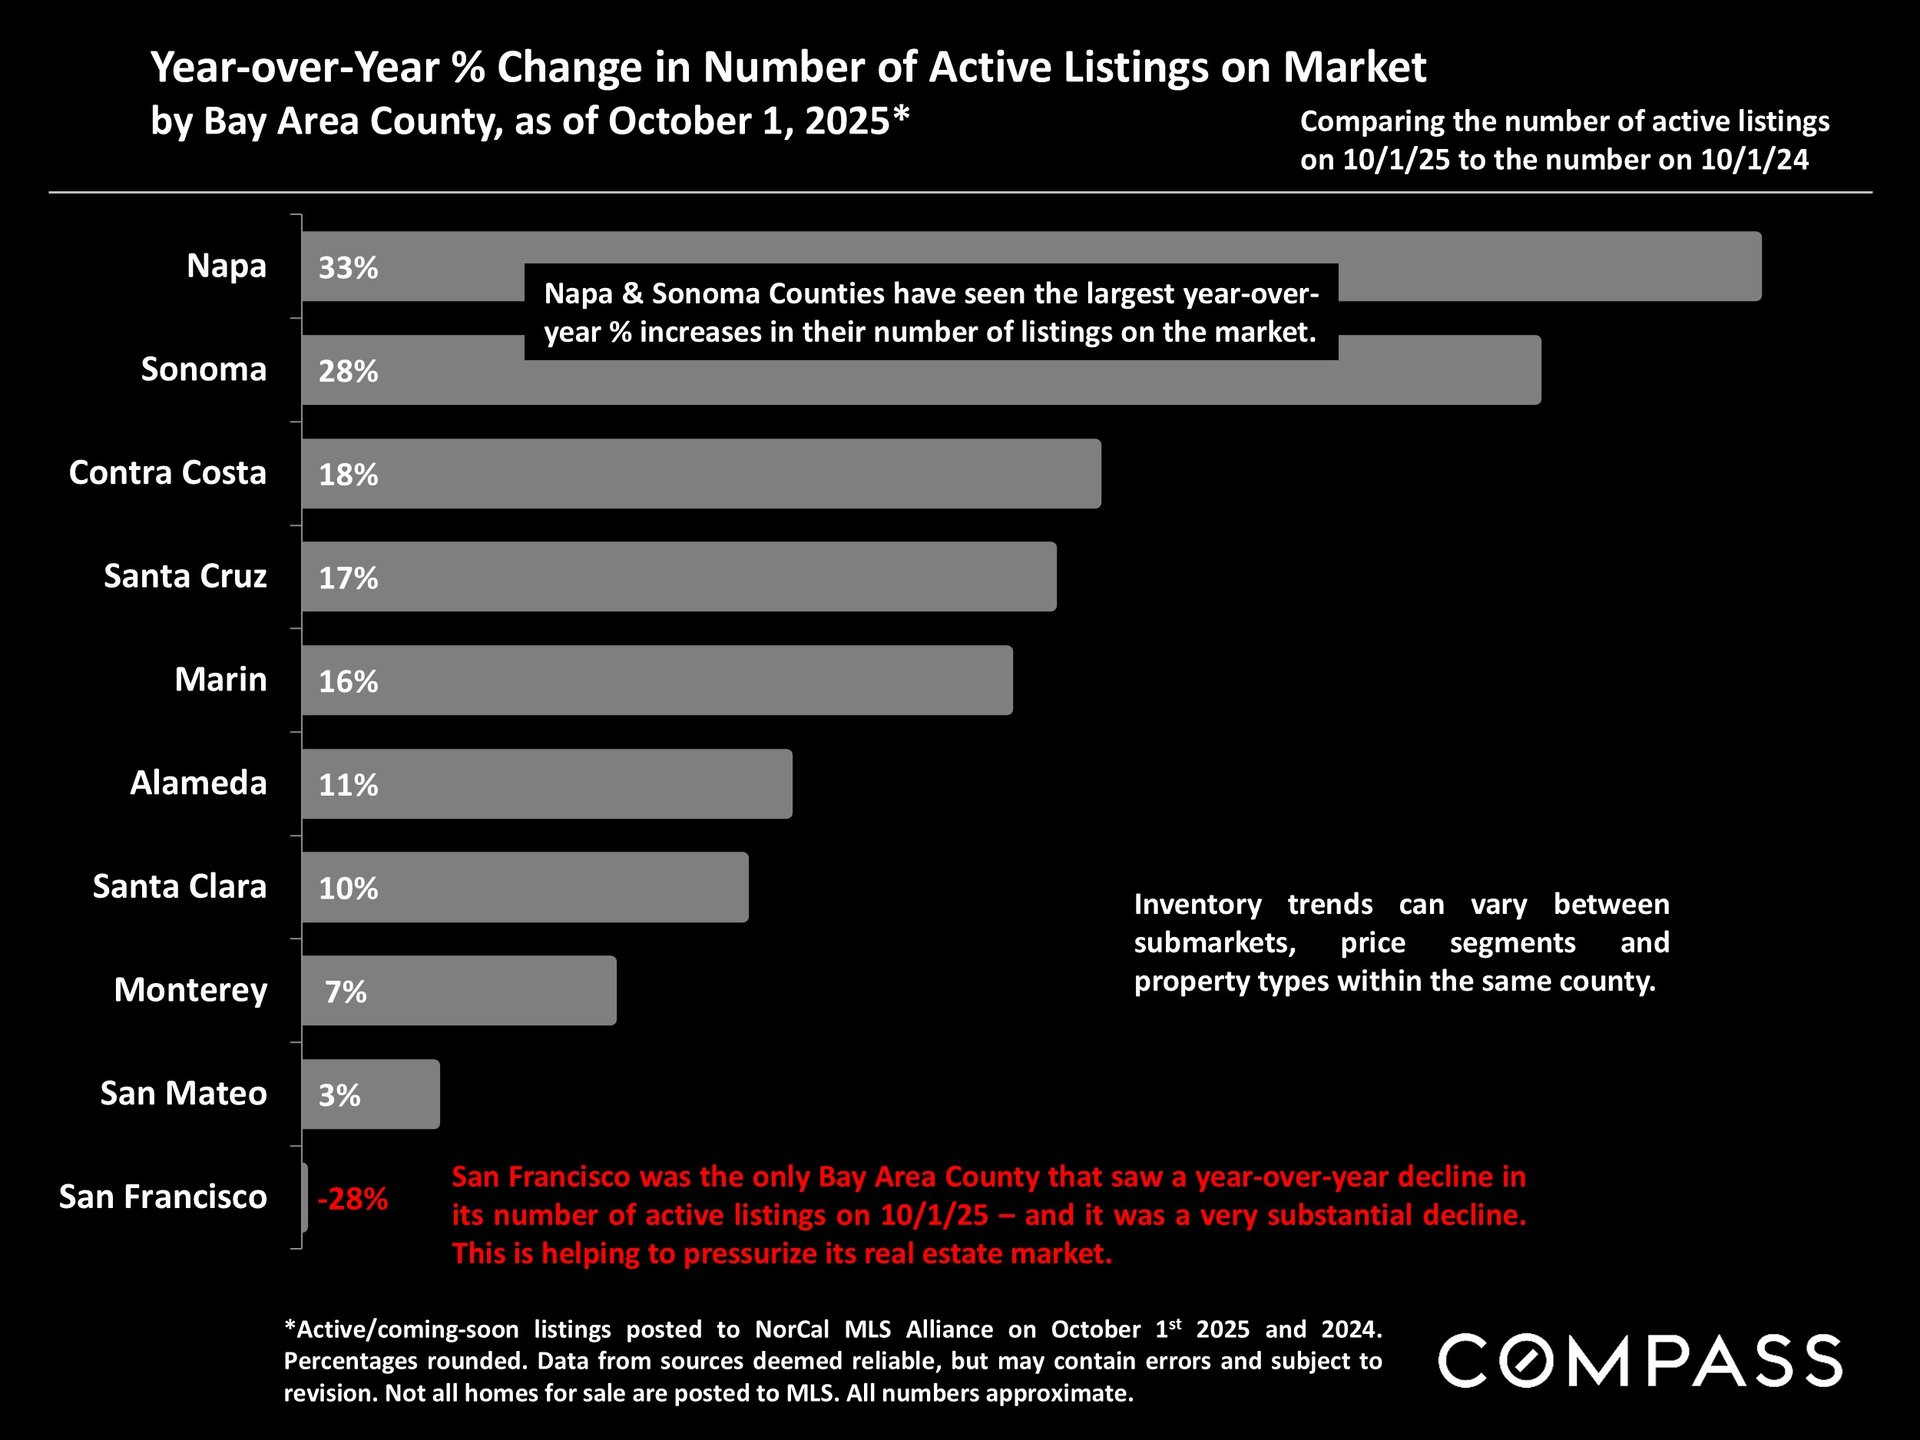
As the fall selling season began, most Bay Area markets saw significant year-over-year (y-o-y) increases in their number of home sales in September. Of the larger county markets, San Francisco had a particularly dramatic 35% increase in sales. All counties except San Francisco had year-over-year increases in their number of active listings on the market, however SF saw its number of homes for sale plunge y-o-y by 28%. The big increase in sales coupled with the large decline in listings has added huge pressure to the SF market.
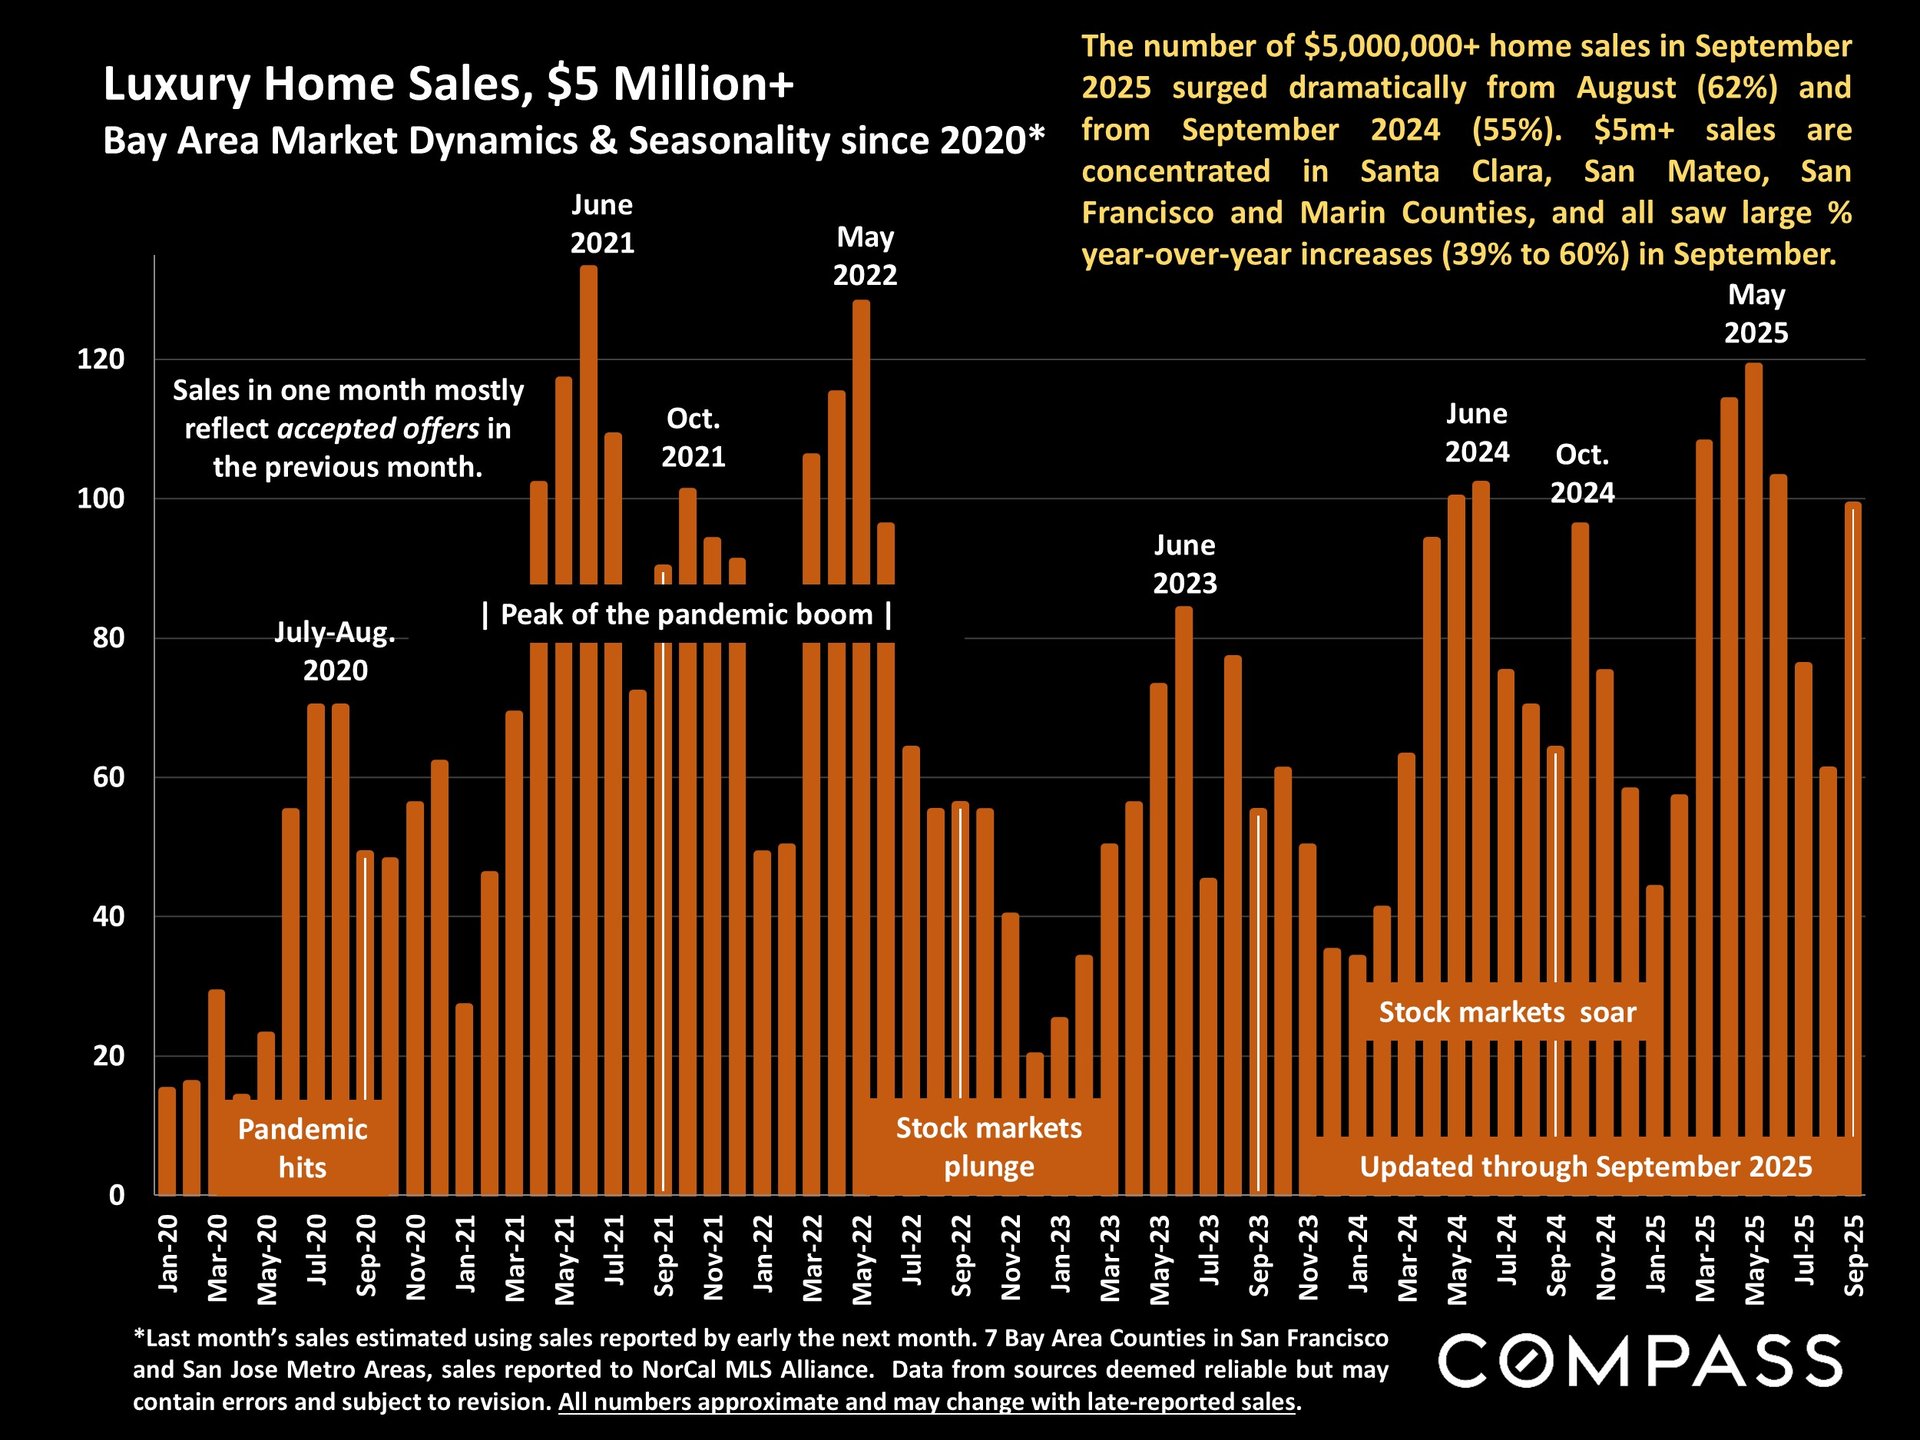
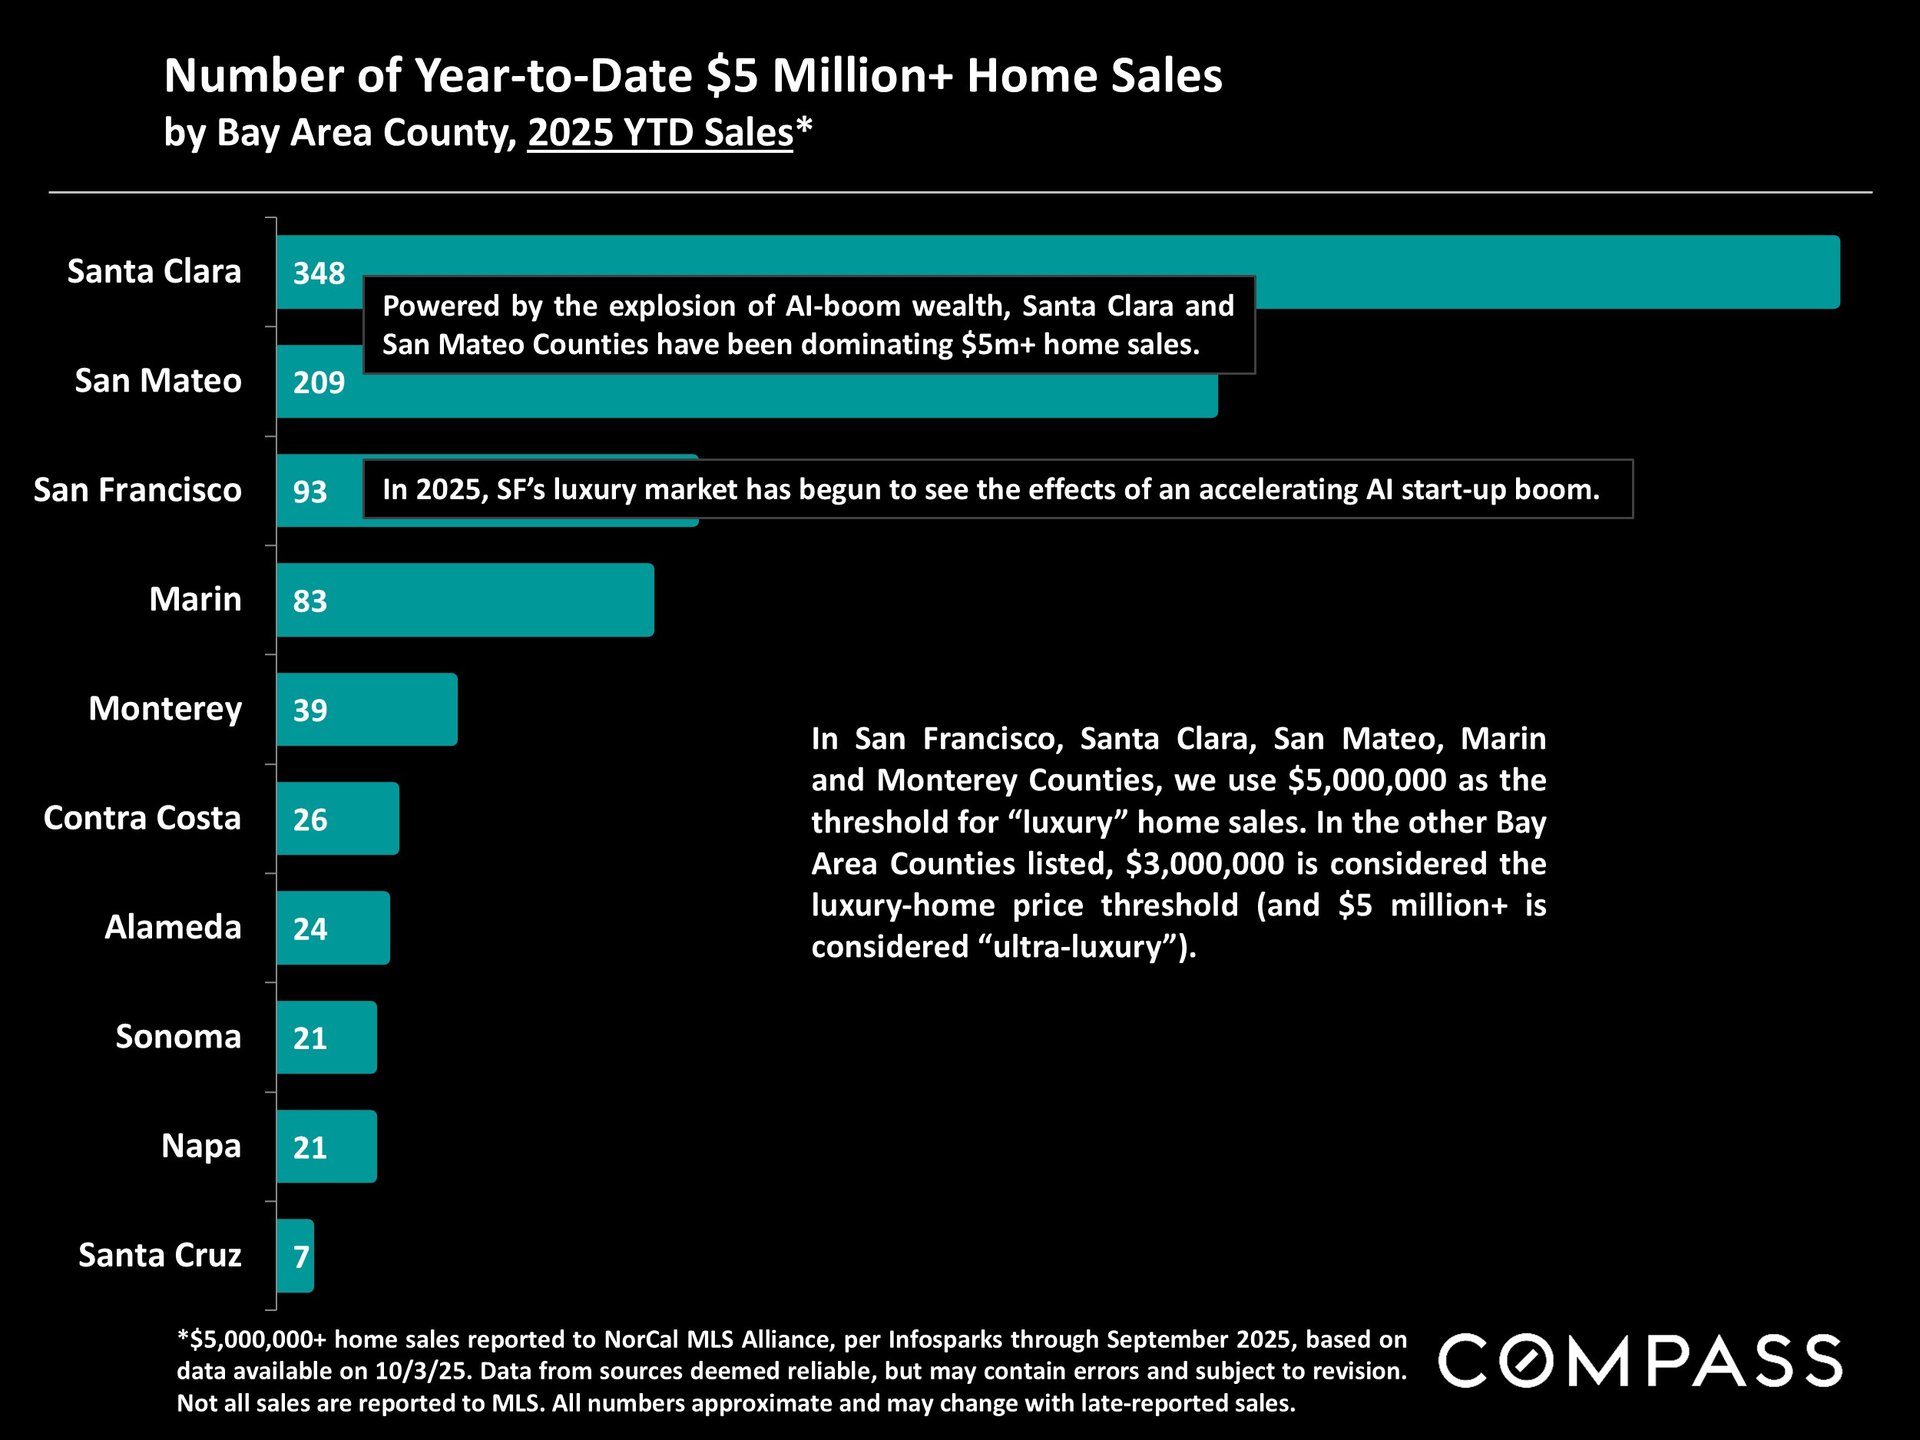
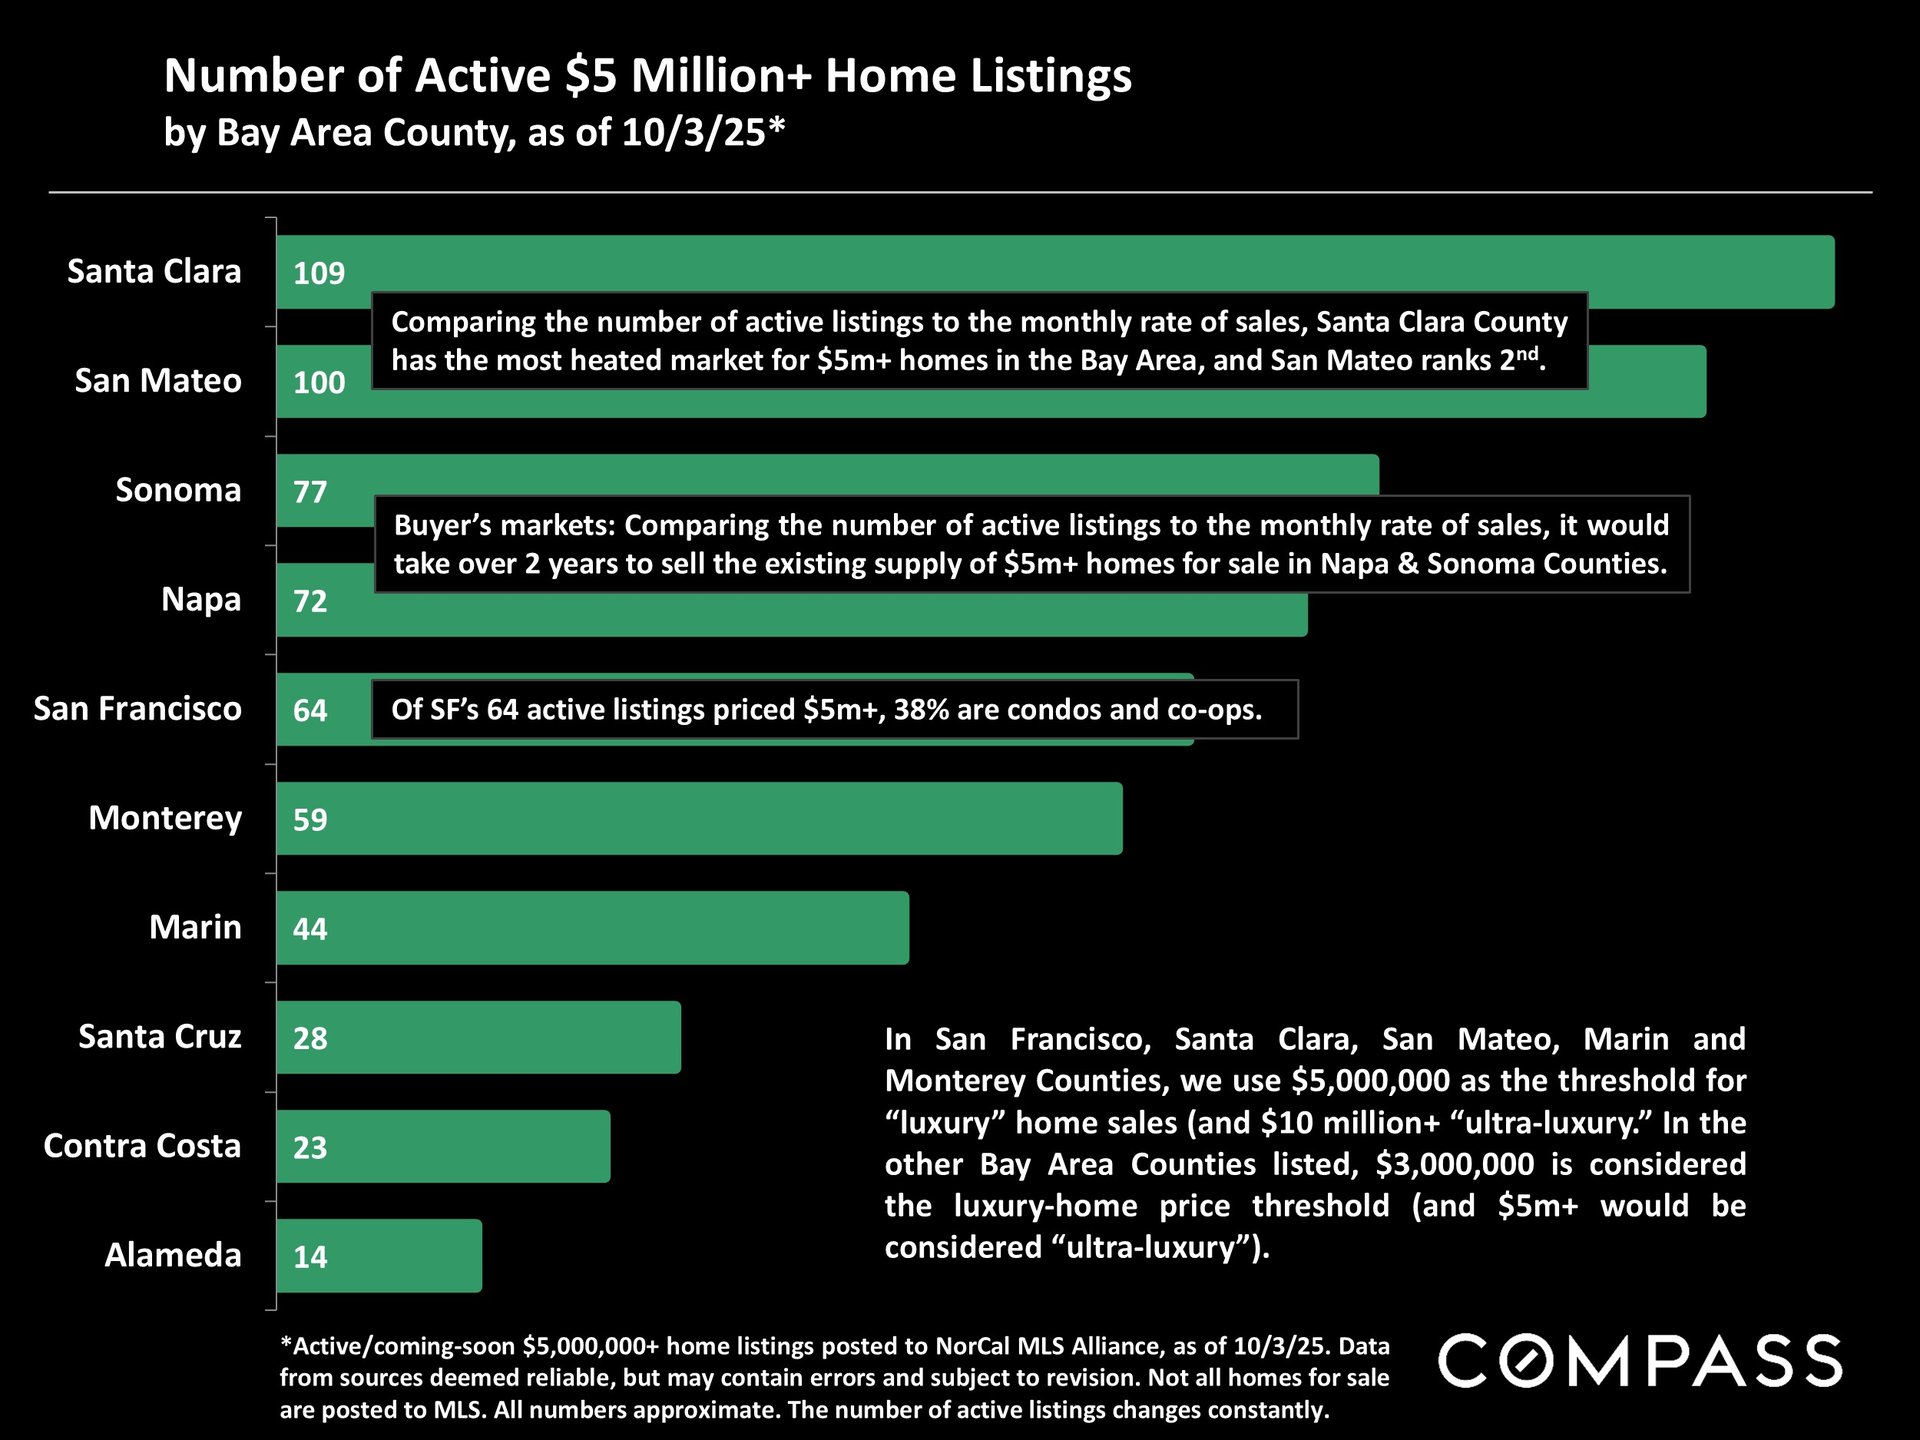
September sales of $5 million+ homes in the Bay Area soared 62% from August and 55% from September 2024. The big markets for $5m+ homes are - in order of sales volume - Santa Clara, San Mateo, San Francisco and Marin Counties: All saw dramatic year-over-year increases of 39% to 60%. Santa Clara and San Mateo Counties, beneficiaries of their more established AI booms, dominate sales in this price segment, with 64% of all year-to-date sales in the Bay Area. The $5m+ markets of Napa and Sonoma Counties remain very strong buyer's markets with high numbers of (spectacular) listings for sale as compared to buyer demand.
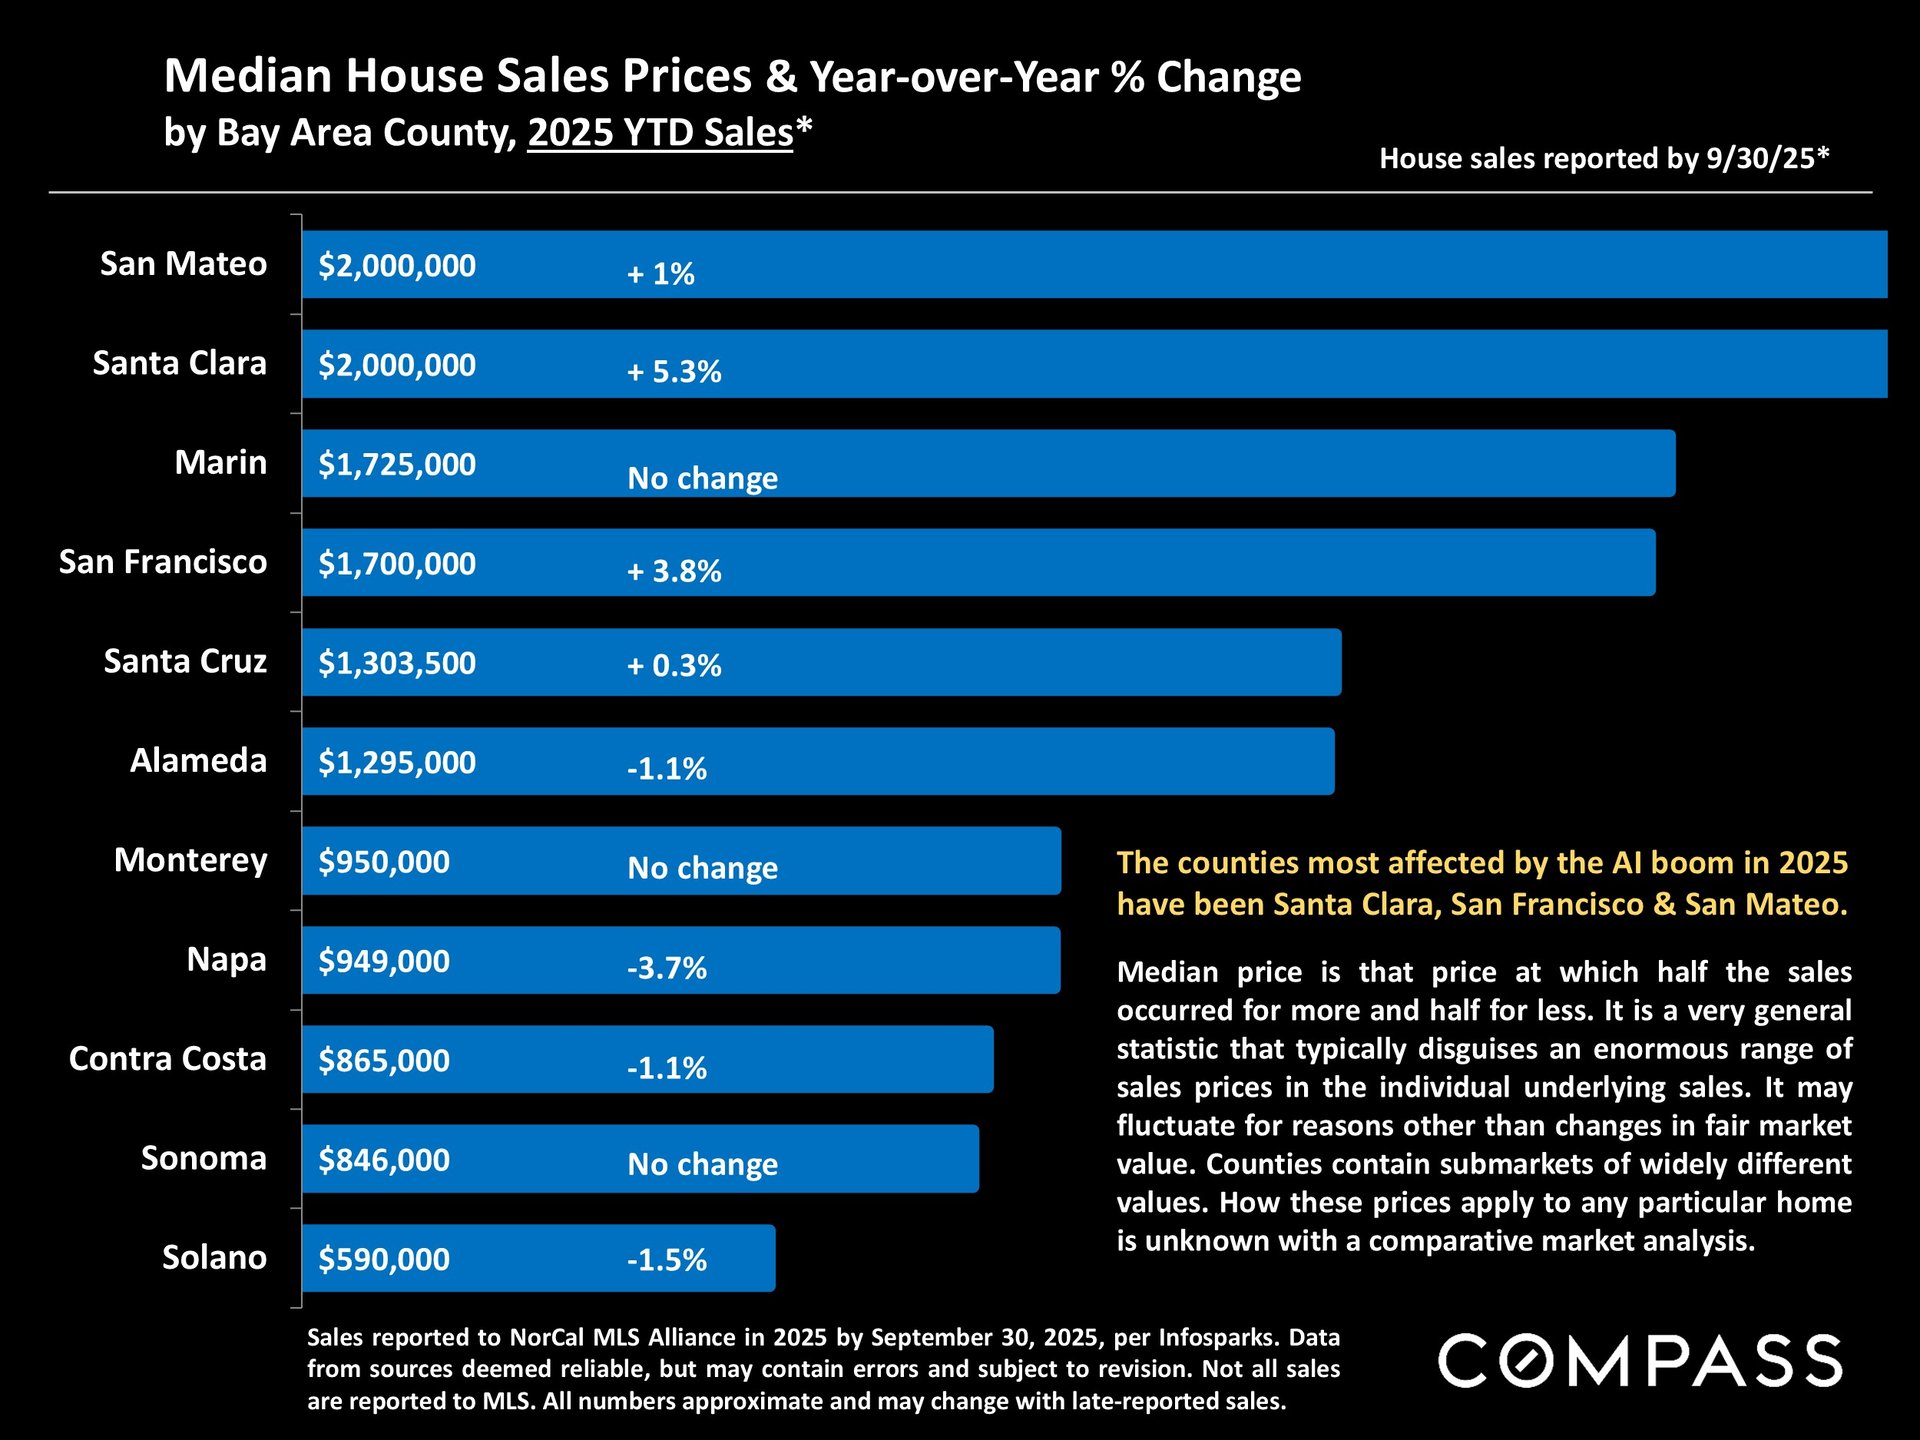
Year-to date median house sales prices increased year-over-year in Santa Clara (5.3%), San Francisco (3.8%) and San Mateo (1%) Counties. Most other Bay Area counties, not (yet) significantly affected by the AI boom and more affected by sluggish economic indicators prevailing in most of 2025 to date, saw unchanged or declining median house prices. Q3 median sales prices (as opposed to YTD prices) shall be delineated in the individual market reports coming next week.
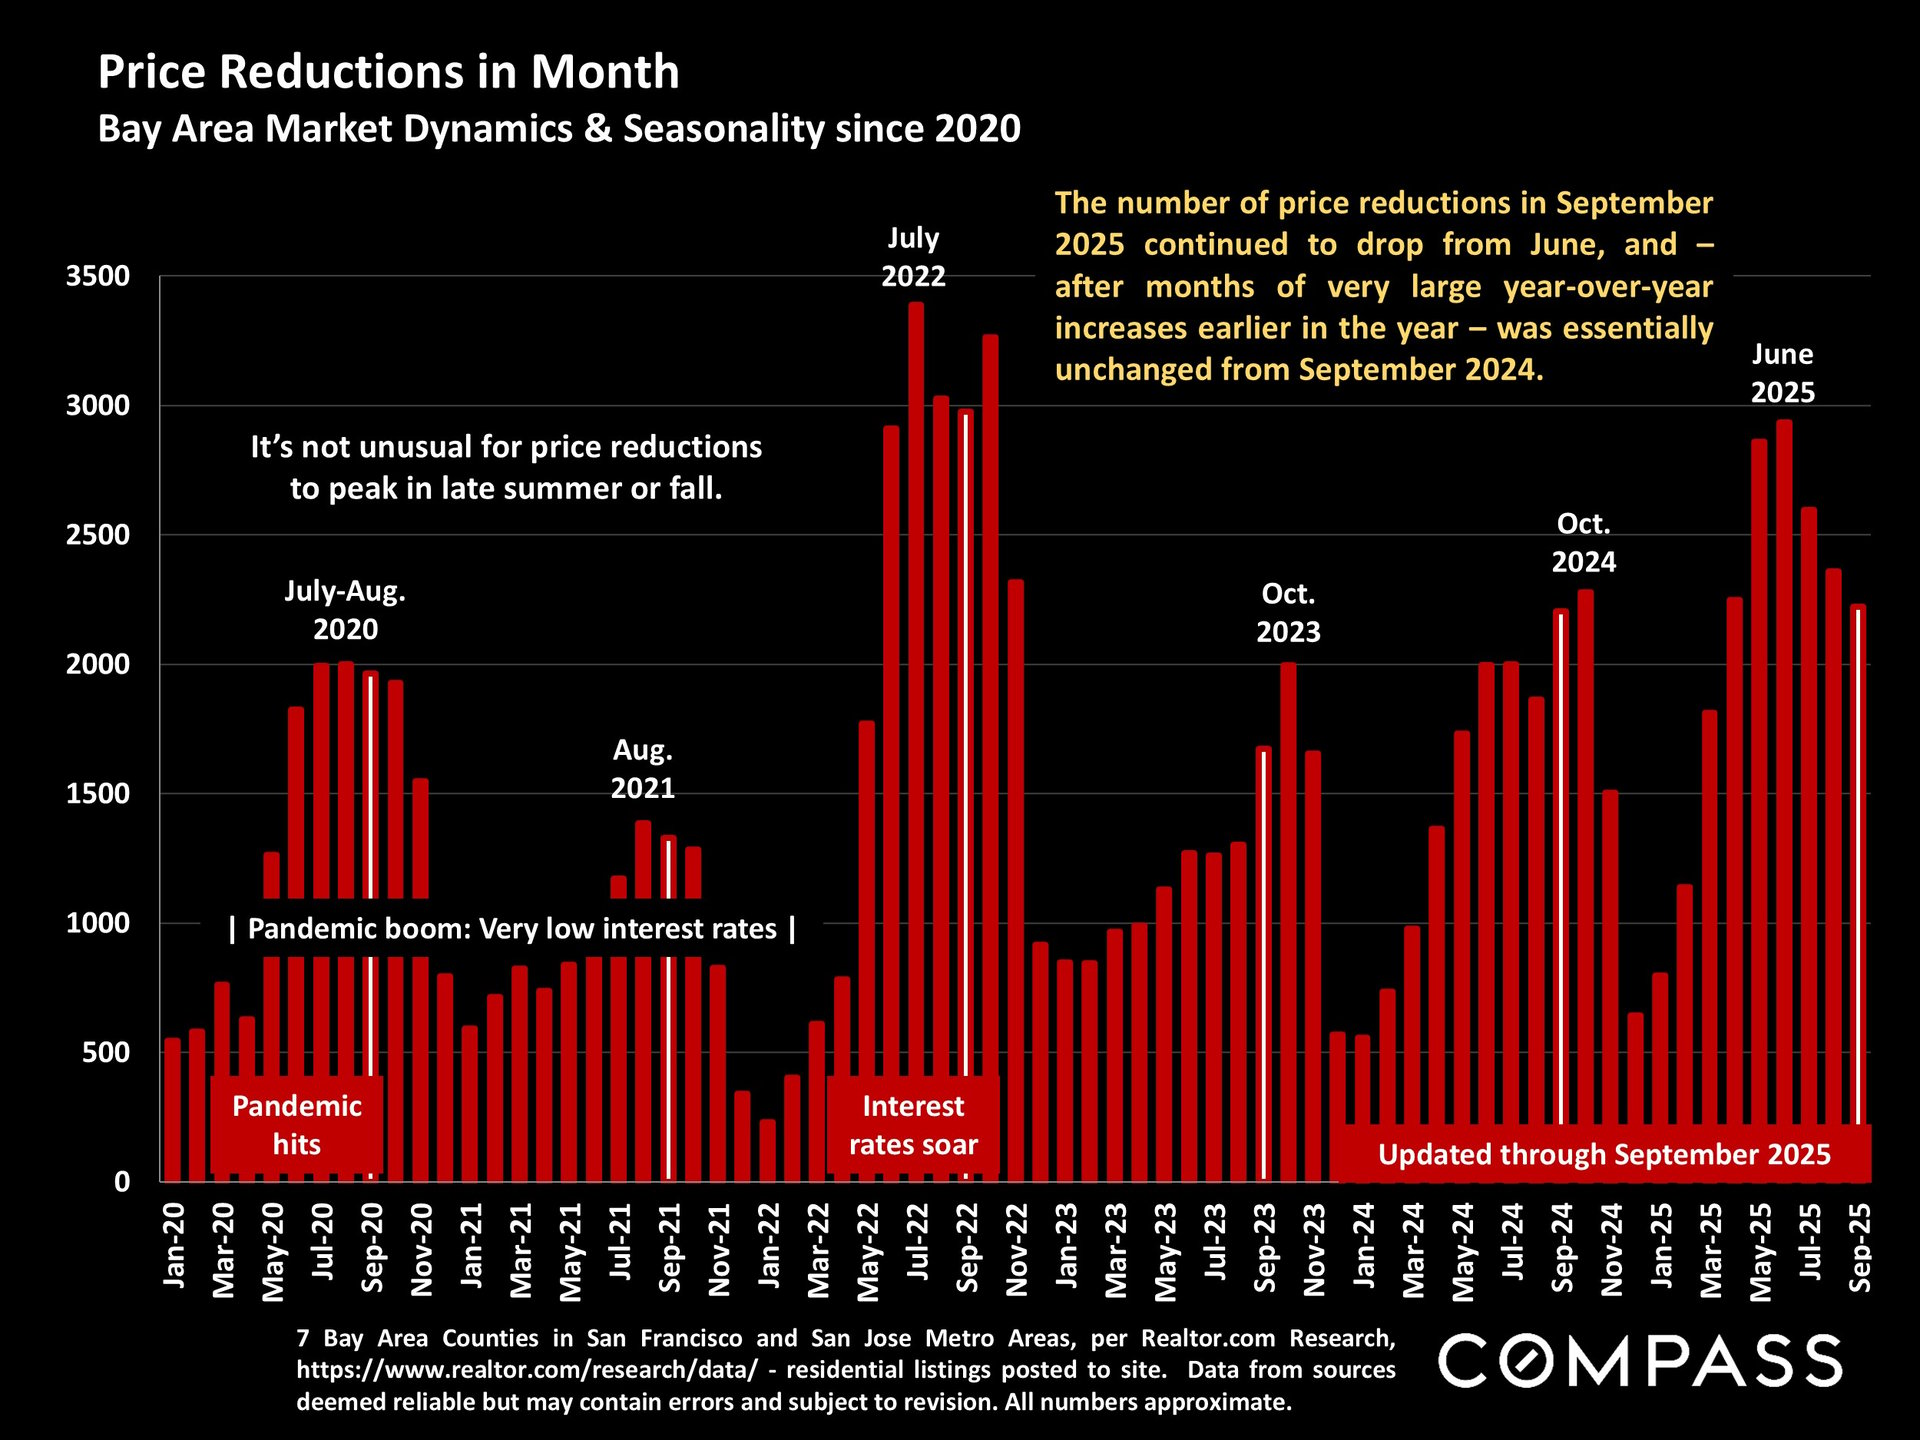
After huge monthly year-over-year increases in the number of price reductions in 2025 - the y-o-y increase in May 2025 was 65% - the number plunged in September, continuing its decline from its June peak, and was essentially unchanged from September 2025, a very significant shift in market dynamics. In most area markets, sellers are no longer racing to reduce prices to attract the attention of buyers.